| Red | Green | Blue | |
| z | 17.64 | ||
| znorm | Inf | ||
| sky | -Inf | -Inf | -Inf |
| S/N | 30.8 | 52.1 | 60.8 |
| S/N(c) | 0.0 | 0.0 | 0.0 |
| SN(E/C) |
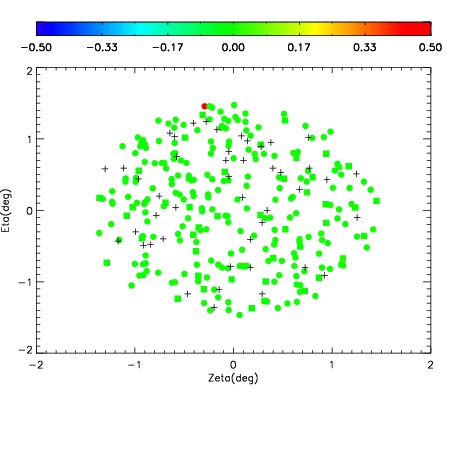
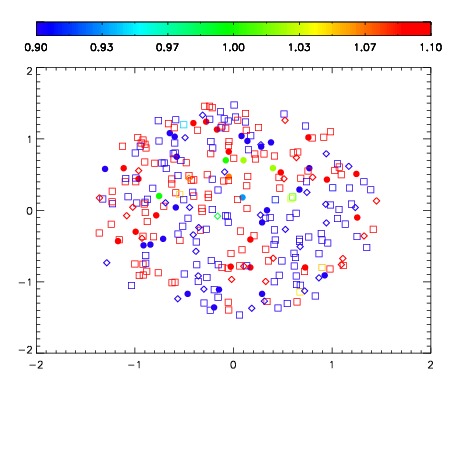
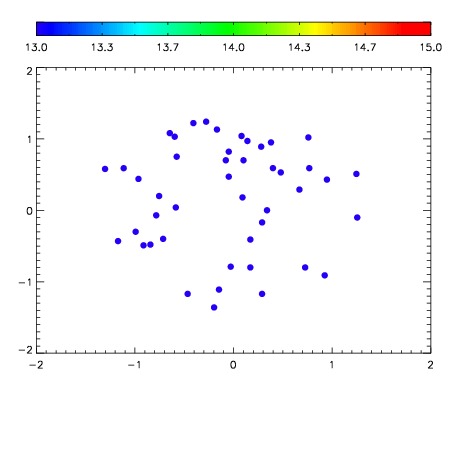

| Frame | Nreads | Zeropoints | Mag plots | Spatial mag deviation | Spatial sky 16325A emission deviations (filled: sky, open: star) | Spatial sky continuum emission | Spatial sky telluric CO2 absorption deviations (filled: H < 10) | |||||||||||||||||||||||
| 0 | 0 |
|
|
|
|
|
|
| 01980042 | 0.00000 | 227.775 |
| 01980043 | 0.00000 | 235.050 |
| 01980044 | 0.00000 | 227.983 |
| 01980045 | 0.00000 | 240.699 |
| 01980046 | 0.00000 | 241.956 |
| 01980047 | 0.00000 | 245.037 |
| 01980048 | 0.00000 | 233.084 |