| Red | Green | Blue | |
| z | 17.64 | ||
| znorm | Inf | ||
| sky | -NaN | -NaN | -Inf |
| S/N | 27.5 | 47.5 | 54.1 |
| S/N(c) | 0.0 | 0.0 | 0.0 |
| SN(E/C) |
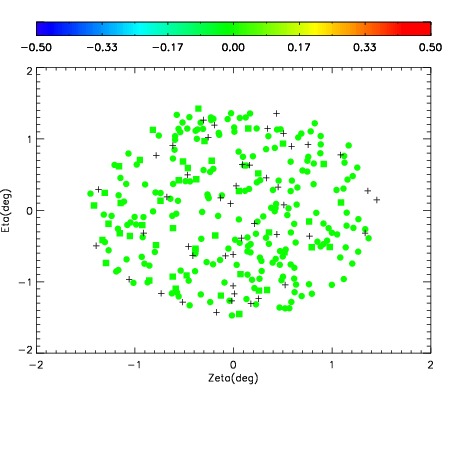
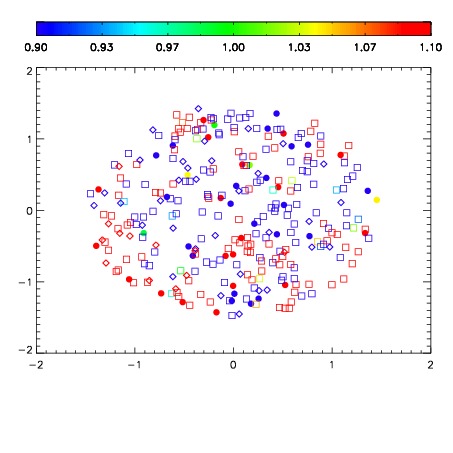
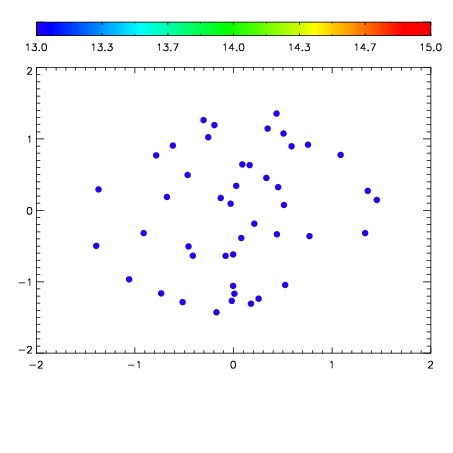

| Frame | Nreads | Zeropoints | Mag plots | Spatial mag deviation | Spatial sky 16325A emission deviations (filled: sky, open: star) | Spatial sky continuum emission | Spatial sky telluric CO2 absorption deviations (filled: H < 10) | |||||||||||||||||||||||
| 0 | 0 |
|
|
|
|
|
|
| 01710089 | 0.00000 | 228.790 |
| 01710090 | 0.00000 | 222.732 |
| 01710091 | 0.00000 | 209.746 |
| 01710092 | 0.00000 | 204.608 |
| 01710093 | 0.00000 | 200.779 |
| 01710094 | 0.00000 | 201.490 |