| Red | Green | Blue | |
| z | 17.63 | ||
| znorm | Inf | ||
| sky | -NaN | -NaN | -Inf |
| S/N | 39.4 | 66.3 | 70.6 |
| S/N(c) | 0.0 | 0.0 | 0.0 |
| SN(E/C) |
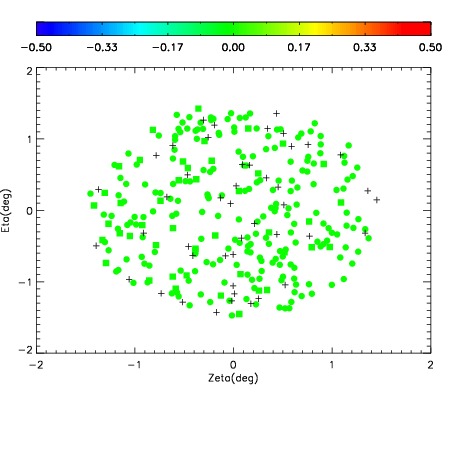
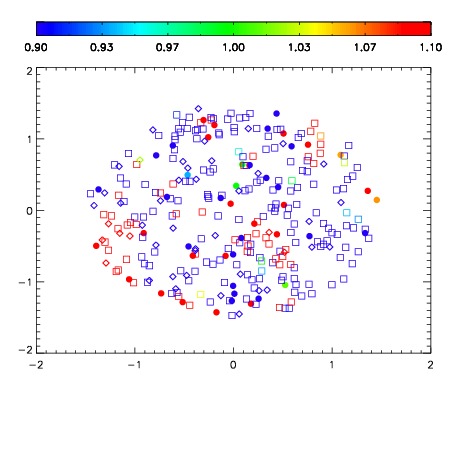
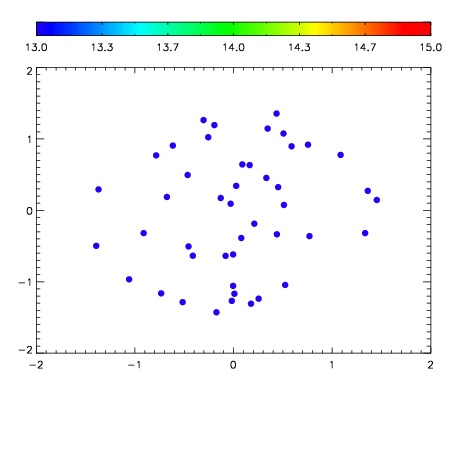

| Frame | Nreads | Zeropoints | Mag plots | Spatial mag deviation | Spatial sky 16325A emission deviations (filled: sky, open: star) | Spatial sky continuum emission | Spatial sky telluric CO2 absorption deviations (filled: H < 10) | |||||||||||||||||||||||
| 0 | 0 |
|
|
|
|
|
|
| 01960061 | 0.00000 | 195.896 |
| 01960062 | 0.00000 | 193.940 |
| 01960063 | 0.00000 | 192.073 |
| 01960064 | 0.00000 | 189.015 |
| 01960065 | 0.00000 | 183.933 |
| 01960066 | 0.00000 | 184.699 |
| 01960067 | 0.00000 | 184.010 |
| 01960068 | 0.00000 | 185.161 |
| 01960069 | 0.00000 | 174.617 |