| Red | Green | Blue | |
| z | 17.64 | ||
| znorm | Inf | ||
| sky | -NaN | -Inf | -Inf |
| S/N | 35.7 | 58.0 | 68.0 |
| S/N(c) | 0.0 | 0.0 | 0.0 |
| SN(E/C) |
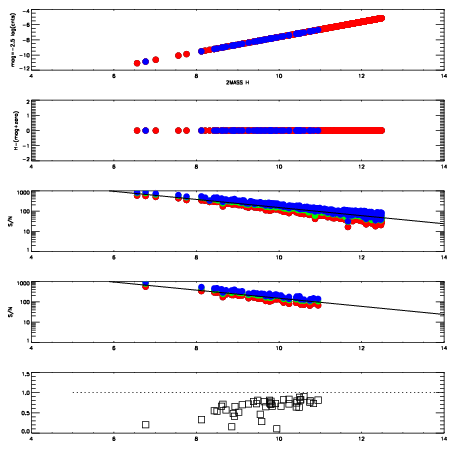
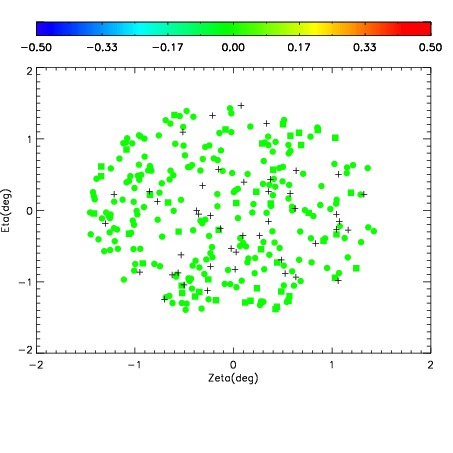
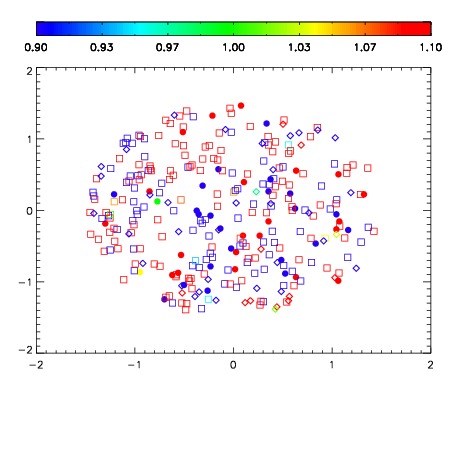


| Frame | Nreads | Zeropoints | Mag plots | Spatial mag deviation | Spatial sky 16325A emission deviations (filled: sky, open: star) | Spatial sky continuum emission | Spatial sky telluric CO2 absorption deviations (filled: H < 10) | |||||||||||||||||||||||
| 0 | 0 |
|
|
|
|
|
|
| 01620069 | 0.00000 | 227.234 |
| 01620070 | 0.00000 | 233.953 |
| 01620071 | 0.00000 | 235.924 |
| 01620072 | 0.00000 | 239.574 |
| 01620073 | 0.00000 | 240.102 |
| 01620074 | 0.00000 | 232.951 |