| Red | Green | Blue | |
| z | 17.64 | ||
| znorm | Inf | ||
| sky | -NaN | -Inf | -Inf |
| S/N | 31.8 | 52.2 | 61.1 |
| S/N(c) | 0.0 | 0.0 | 0.0 |
| SN(E/C) |
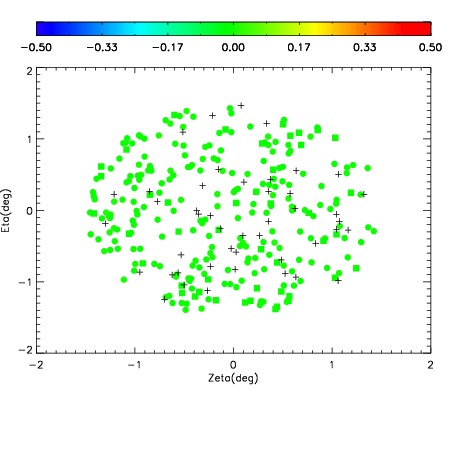
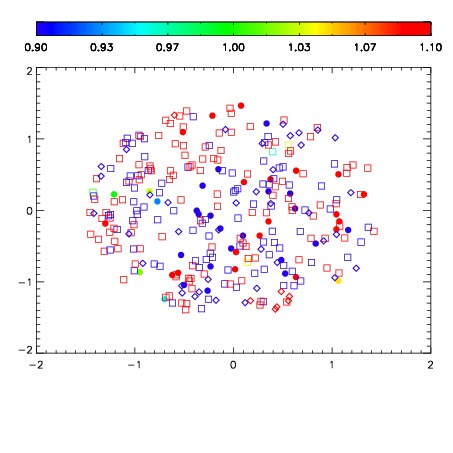
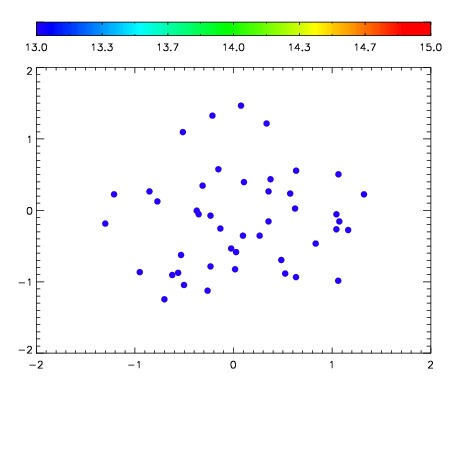

| Frame | Nreads | Zeropoints | Mag plots | Spatial mag deviation | Spatial sky 16325A emission deviations (filled: sky, open: star) | Spatial sky continuum emission | Spatial sky telluric CO2 absorption deviations (filled: H < 10) | |||||||||||||||||||||||
| 0 | 0 |
|
|
|
|
|
|
| 01630063 | 0.00000 | 198.903 |
| 01630064 | 0.00000 | 211.811 |
| 01630065 | 0.00000 | 206.159 |
| 01630066 | 0.00000 | 216.623 |
| 01630067 | 0.00000 | 216.481 |
| 01630068 | 0.00000 | 215.754 |