| Red | Green | Blue | |
| z | 17.64 | ||
| znorm | Inf | ||
| sky | -NaN | -NaN | -Inf |
| S/N | 35.5 | 62.4 | 67.8 |
| S/N(c) | 0.0 | 0.0 | 0.0 |
| SN(E/C) |
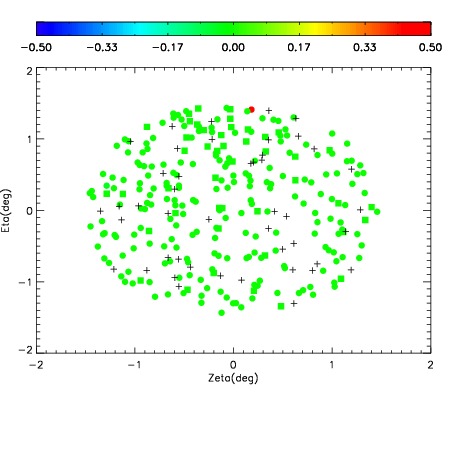
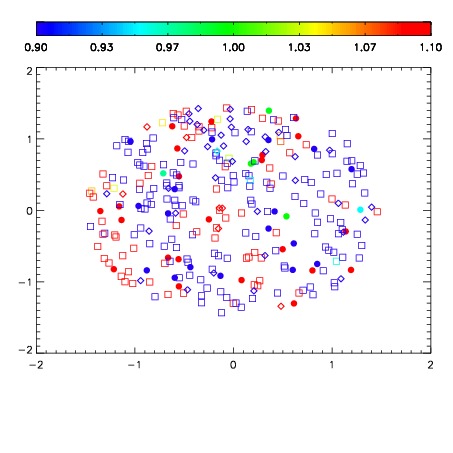
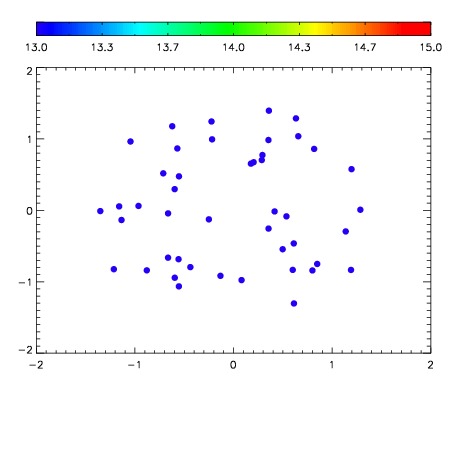

| Frame | Nreads | Zeropoints | Mag plots | Spatial mag deviation | Spatial sky 16325A emission deviations (filled: sky, open: star) | Spatial sky continuum emission | Spatial sky telluric CO2 absorption deviations (filled: H < 10) | |||||||||||||||||||||||
| 0 | 0 |
|
|
|
|
|
|
| 01650076 | 0.00000 | 120.567 |
| 01650077 | 0.00000 | 103.776 |
| 01650078 | 0.00000 | 71.2474 |
| 01650079 | 0.00000 | 37.1611 |
| 01650080 | 0.00000 | 125.373 |
| 01650081 | 0.00000 | 109.671 |
| 01650082 | 0.00000 | 79.2782 |
| 01650083 | 0.00000 | 48.8990 |
| 01650084 | 0.00000 | 127.121 |
| 01650085 | 0.00000 | 178.005 |
| 01650086 | 0.00000 | 186.345 |
| 01650087 | 0.00000 | 184.005 |
| 01650088 | 0.00000 | 190.072 |
| 01650089 | 0.00000 | 190.787 |
| 01650090 | 0.00000 | 193.140 |