| Red | Green | Blue | |
| z | 17.63 | ||
| znorm | Inf | ||
| sky | -NaN | -NaN | -Inf |
| S/N | 45.7 | 77.0 | 83.7 |
| S/N(c) | 0.0 | 0.0 | 0.0 |
| SN(E/C) |
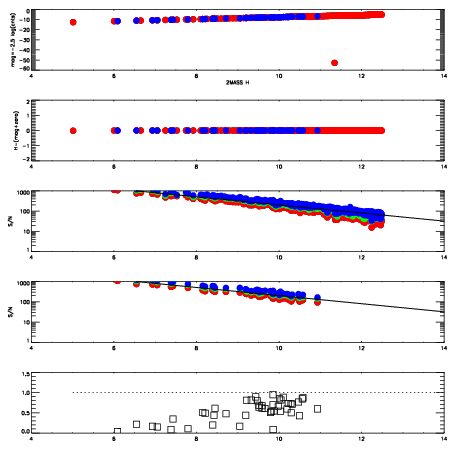
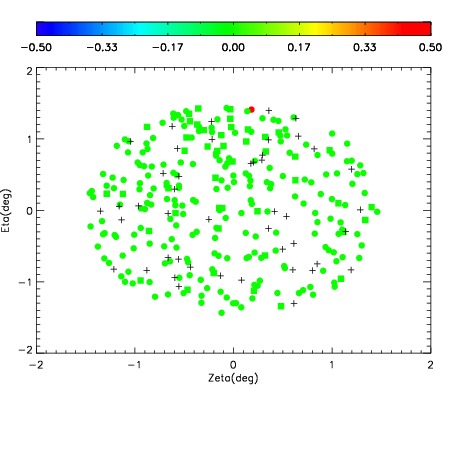
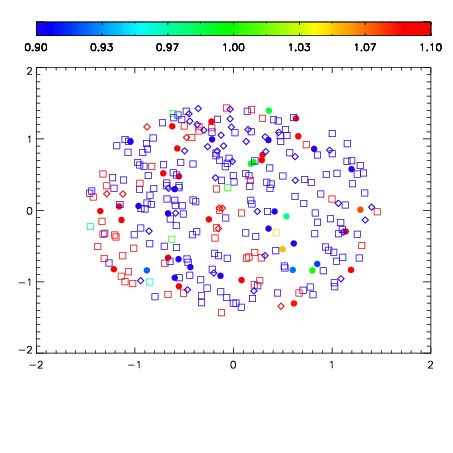
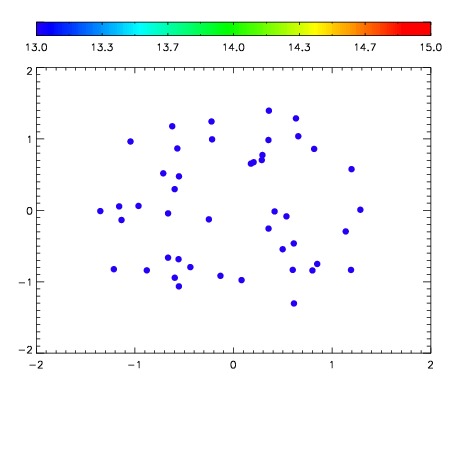

| Frame | Nreads | Zeropoints | Mag plots | Spatial mag deviation | Spatial sky 16325A emission deviations (filled: sky, open: star) | Spatial sky continuum emission | Spatial sky telluric CO2 absorption deviations (filled: H < 10) | |||||||||||||||||||||||
| 0 | 0 |
|
|
|
|
|
|
| 01660062 | 0.00000 | 180.965 |
| 01660063 | 0.00000 | 183.970 |
| 01660064 | 0.00000 | 184.666 |
| 01660065 | 0.00000 | 179.819 |
| 01660066 | 0.00000 | 184.347 |
| 01660067 | 0.00000 | 184.589 |
| 01660068 | 0.00000 | 189.454 |
| 01660069 | 0.00000 | 191.407 |
| 01660070 | 0.00000 | 189.952 |
| 01660071 | 0.00000 | 191.411 |
| 01660072 | 0.00000 | 191.304 |