| Red | Green | Blue | |
| z | 17.63 | ||
| znorm | Inf | ||
| sky | -NaN | -NaN | -Inf |
| S/N | 35.2 | 57.6 | 66.7 |
| S/N(c) | 0.0 | 0.0 | 0.0 |
| SN(E/C) |
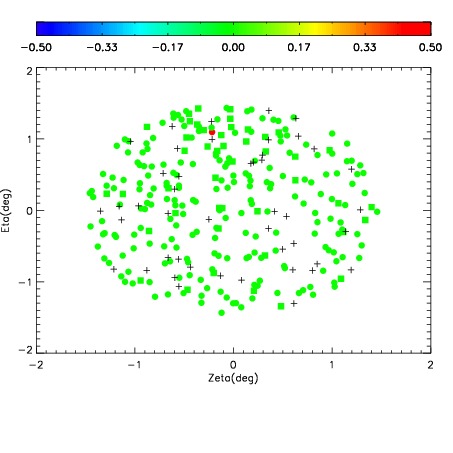
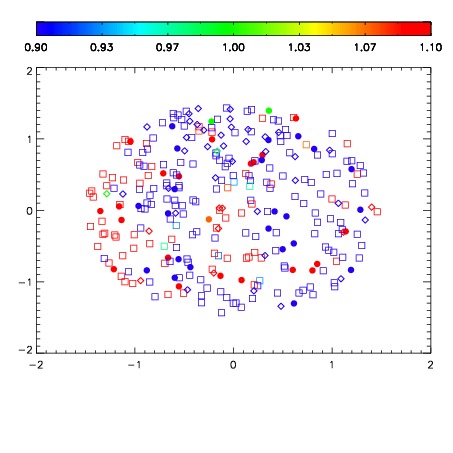
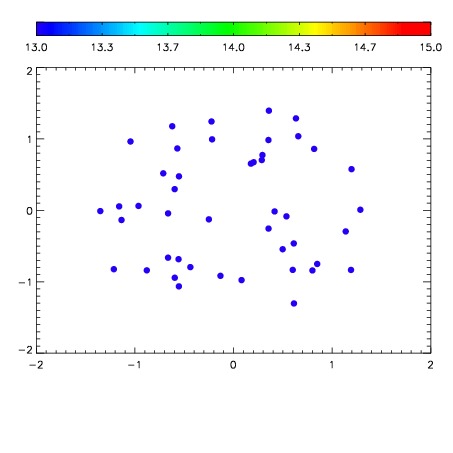

| Frame | Nreads | Zeropoints | Mag plots | Spatial mag deviation | Spatial sky 16325A emission deviations (filled: sky, open: star) | Spatial sky continuum emission | Spatial sky telluric CO2 absorption deviations (filled: H < 10) | |||||||||||||||||||||||
| 0 | 0 |
|
|
|
|
|
|
| 01950047 | 0.00000 | 199.376 |
| 01950048 | 0.00000 | 189.507 |
| 01950049 | 0.00000 | 186.815 |
| 01950050 | 0.00000 | 179.358 |
| 01950051 | 0.00000 | 180.344 |
| 01950052 | 0.00000 | 176.506 |
| 01950053 | 0.00000 | 154.759 |
| 01950056 | 0.00000 | 184.212 |
| 01950057 | 0.00000 | 163.985 |