| Red | Green | Blue | |
| z | 17.64 | ||
| znorm | Inf | ||
| sky | -NaN | -NaN | -Inf |
| S/N | 27.4 | 47.6 | 53.7 |
| S/N(c) | 0.0 | 0.0 | 0.0 |
| SN(E/C) |
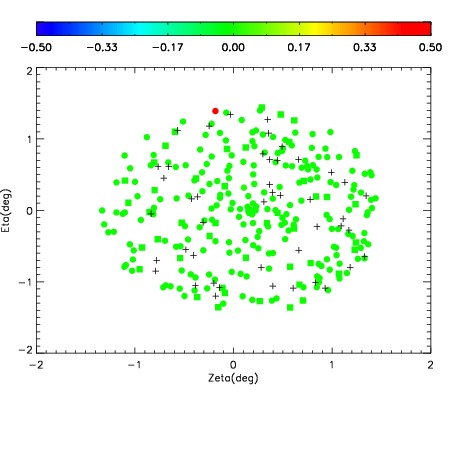
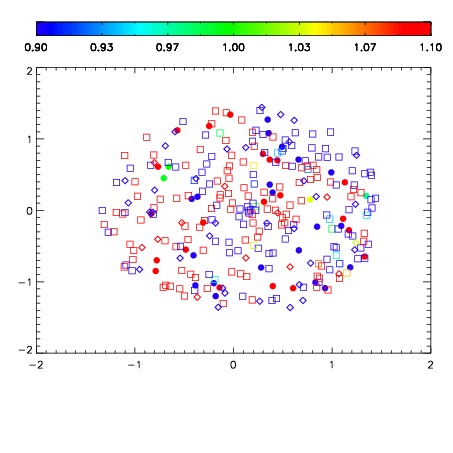
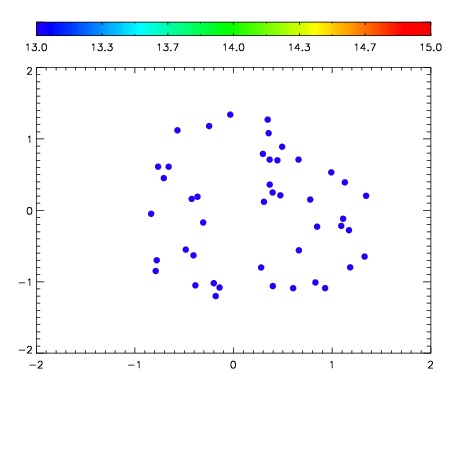

| Frame | Nreads | Zeropoints | Mag plots | Spatial mag deviation | Spatial sky 16325A emission deviations (filled: sky, open: star) | Spatial sky continuum emission | Spatial sky telluric CO2 absorption deviations (filled: H < 10) | |||||||||||||||||||||||
| 0 | 0 |
|
|
|
|
|
|
| 01700050 | 0.00000 | 134.707 |
| 01700051 | 0.00000 | 135.488 |
| 01700052 | 0.00000 | 146.314 |
| 01700053 | 0.00000 | 156.890 |
| 01700054 | 0.00000 | 149.688 |
| 01700055 | 0.00000 | 147.631 |
| 01700056 | 0.00000 | 129.668 |