| Red | Green | Blue | |
| z | 17.64 | ||
| znorm | Inf | ||
| sky | -Inf | -NaN | -Inf |
| S/N | 28.6 | 48.3 | 58.8 |
| S/N(c) | 0.0 | 0.0 | 0.0 |
| SN(E/C) |
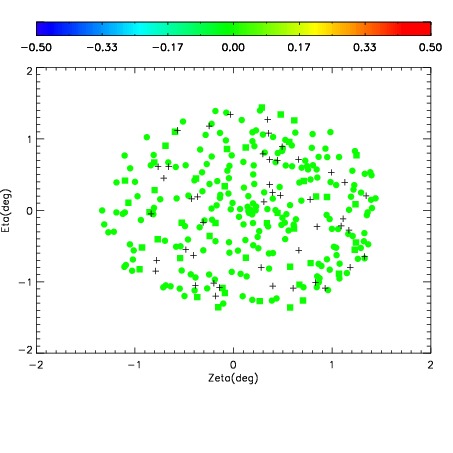
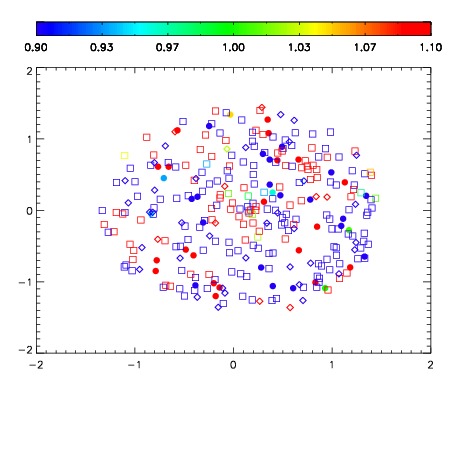


| Frame | Nreads | Zeropoints | Mag plots | Spatial mag deviation | Spatial sky 16325A emission deviations (filled: sky, open: star) | Spatial sky continuum emission | Spatial sky telluric CO2 absorption deviations (filled: H < 10) | |||||||||||||||||||||||
| 0 | 0 |
|
|
|
|
|
|
| 01930048 | 0.00000 | 203.026 |
| 01930049 | 0.00000 | 191.243 |
| 01930050 | 0.00000 | 183.914 |
| 01930051 | 0.00000 | 200.428 |
| 01930052 | 0.00000 | 121.643 |
| 01930053 | 0.00000 | 179.800 |
| 01930054 | 0.00000 | 172.360 |