| Frame | Nreads | Zeropoints | Mag plots
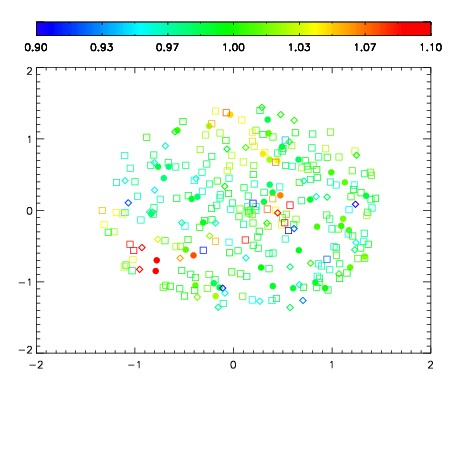
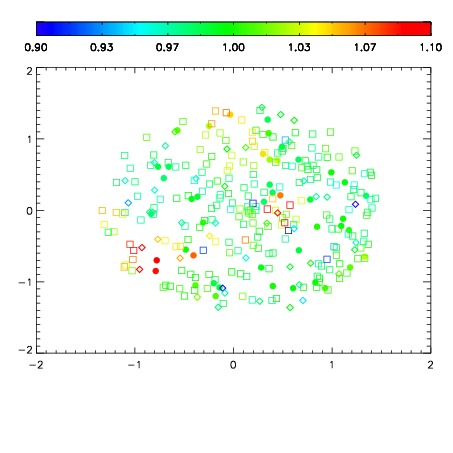
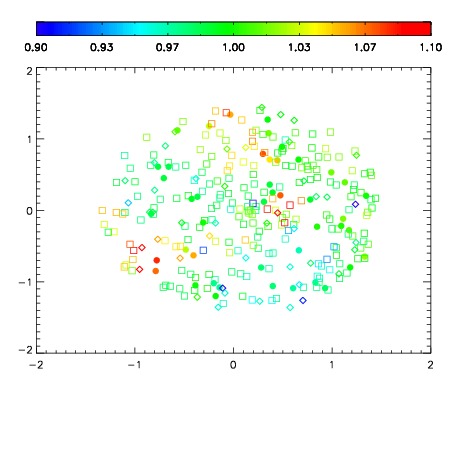
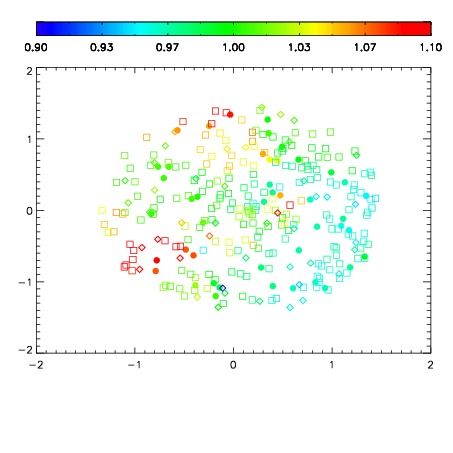
| Spatial mag deviation
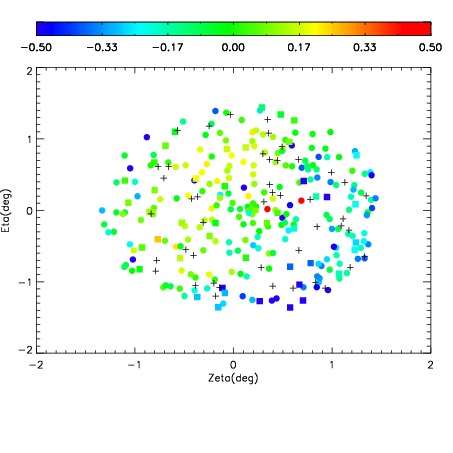
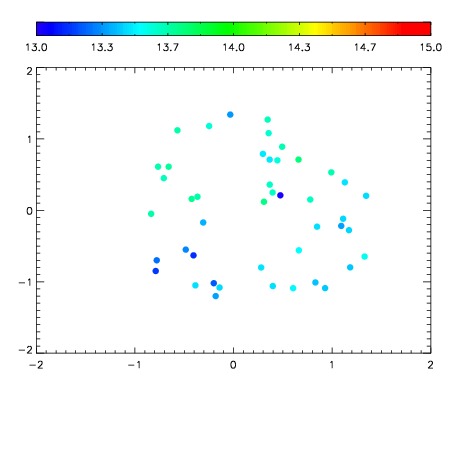
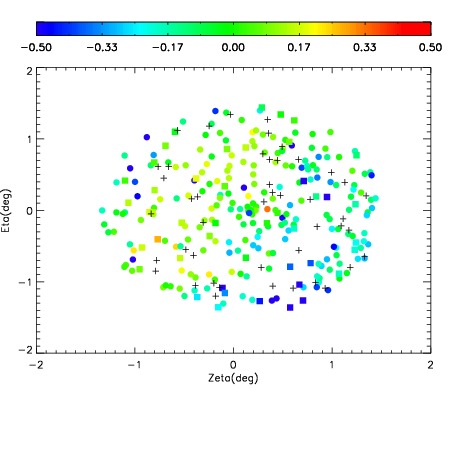
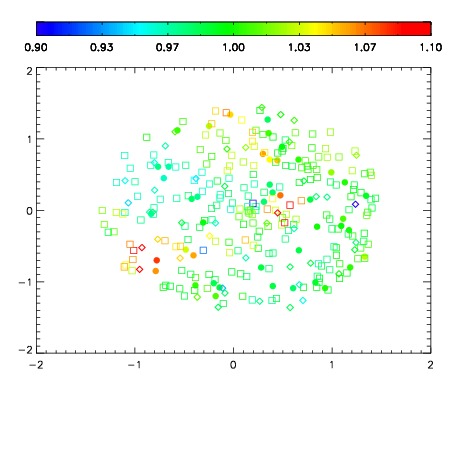
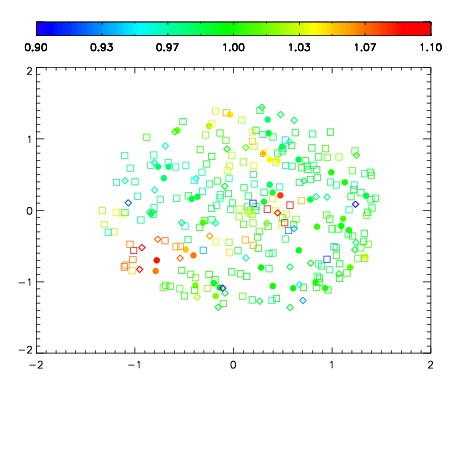
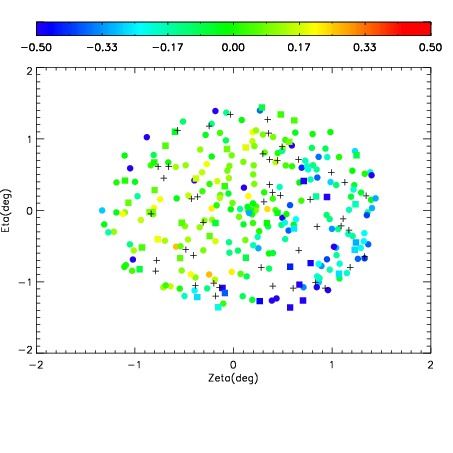
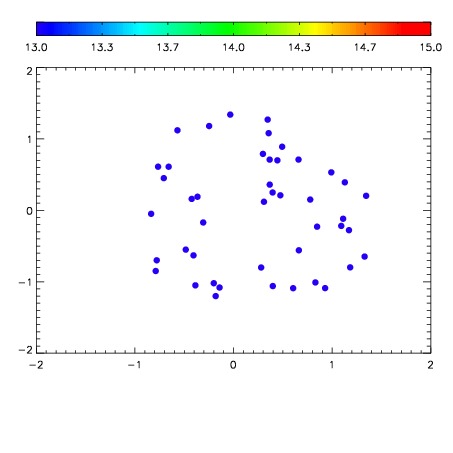
| Spatial sky 16325A emission deviations (filled: sky, open: star)
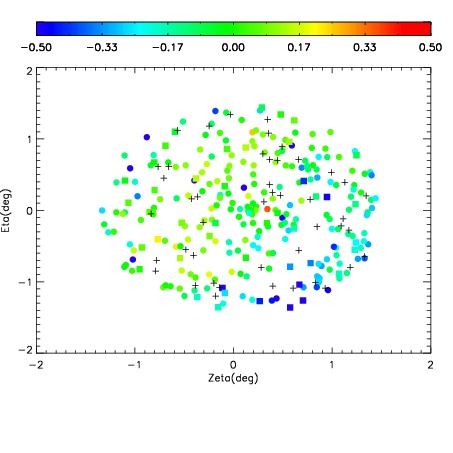
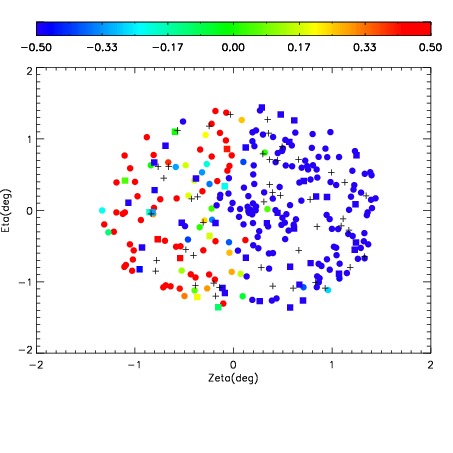
| Spatial sky continuum emission
| Spatial sky telluric CO2 absorption deviations (filled: H < 10)
|
| 1970042
| 50
| | Red | Green | Blue
| | z | | 18.72
| | znorm | | 14.47
| | sky | 13.7 | 13.5 | 13.6
| | S/N | 12.0 | 18.5 | 21.4
| | S/N(c) | 10.5 | 17.7 | 20.4
| | SN(E/C) 0.69
|
| 
| 
| 
| 
| 
|
| 1970043
| 50
| | Red | Green | Blue
| | z | | 18.49
| | znorm | | 14.24
| | sky | 13.2 | 13.1 | 13.1
| | S/N | 9.4 | 14.7 | 17.2
| | S/N(c) | 8.0 | 13.9 | 16.0
| | SN(E/C) 0.73
|
| 
| 
| 
| 
| 
|
| 1970044
| 50
| | Red | Green | Blue
| | z | | 18.11
| | znorm | | 13.87
| | sky | 12.4 | 12.3 | 12.3
| | S/N | 5.9 | 9.5 | 10.9
| | S/N(c) | 5.7 | 9.8 | 11.1
| | SN(E/C) 0.83
|
| 
| 
| 
| 
| 
|
| 1970045
| 50
| | Red | Green | Blue
| | z | | 17.62
| | znorm | | 13.37
| | sky | 12.2 | 12.1 | 12.1
| | S/N | 3.7 | 6.3 | 6.3
| | S/N(c) | 3.6 | 5.8 | 7.1
| | SN(E/C) 0.87
|
| 
| 
| 
| 
| 
|
| 1970046
| 50
| | Red | Green | Blue
| | z | | 18.47
| | znorm | | 14.23
| | sky | 13.1 | 13.0 | 13.0
| | S/N | 9.1 | 14.8 | 16.9
| | S/N(c) | 8.2 | 14.1 | 15.8
| | SN(E/C) 0.73
|
| 
| 
| 
| 
| 
|
| 1970047
| 50
| | Red | Green | Blue
| | z | | 18.22
| | znorm | | 13.97
| | sky | 12.6 | 12.5 | 12.5
| | S/N | 6.8 | 11.3 | 13.1
| | S/N(c) | 6.6 | 11.1 | 12.6
| | SN(E/C) 0.81
|
| 
| 
| 
| 
| 
|
| 1970048
| 50
| | Red | Green | Blue
| | z | | 15.02
| | znorm | | 10.78
| | sky | 12.3 | 12.2 | 12.2
| | S/N | 0.2 | 0.5 | -0.1
| | S/N(c) | 0.1 | 0.3 | 0.3
| | SN(E/C) 0.86
|
| 
| 
| 
| 
| 
|