| Red | Green | Blue | |
| z | 17.64 | ||
| znorm | Inf | ||
| sky | -Inf | -Inf | -Inf |
| S/N | 18.4 | 31.4 | 35.4 |
| S/N(c) | 0.0 | 0.0 | 0.0 |
| SN(E/C) |
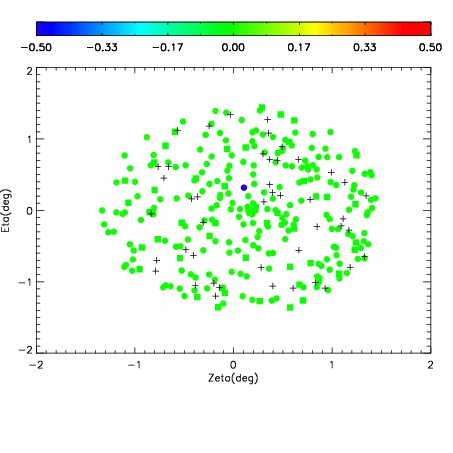
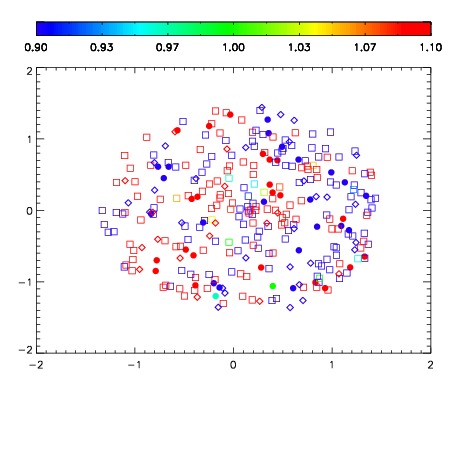
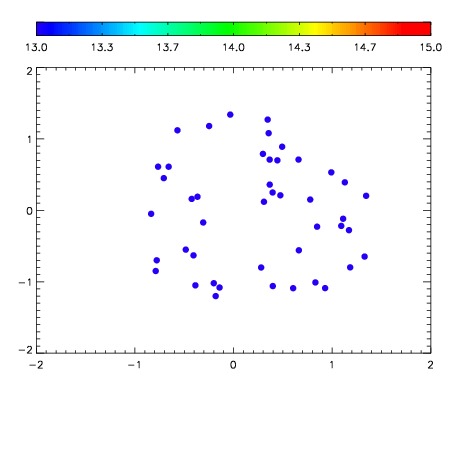

| Frame | Nreads | Zeropoints | Mag plots | Spatial mag deviation | Spatial sky 16325A emission deviations (filled: sky, open: star) | Spatial sky continuum emission | Spatial sky telluric CO2 absorption deviations (filled: H < 10) | |||||||||||||||||||||||
| 0 | 0 |
|
|
|
|
|
|
| 01970042 | 0.00000 | 155.094 |
| 01970043 | 0.00000 | 138.122 |
| 01970044 | 0.00000 | 113.892 |
| 01970045 | 0.00000 | 80.8864 |
| 01970046 | 0.00000 | 138.455 |
| 01970047 | 0.00000 | 114.794 |
| 01970048 | 0.00000 | 10.1636 |