| Red | Green | Blue | |
| z | 17.64 | ||
| znorm | Inf | ||
| sky | -Inf | -NaN | -Inf |
| S/N | 28.0 | 49.3 | 53.2 |
| S/N(c) | 0.0 | 0.0 | 0.0 |
| SN(E/C) |
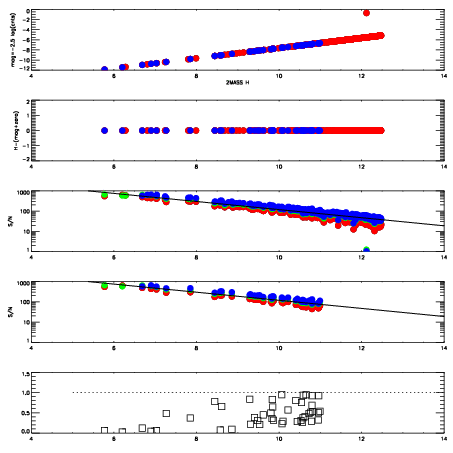
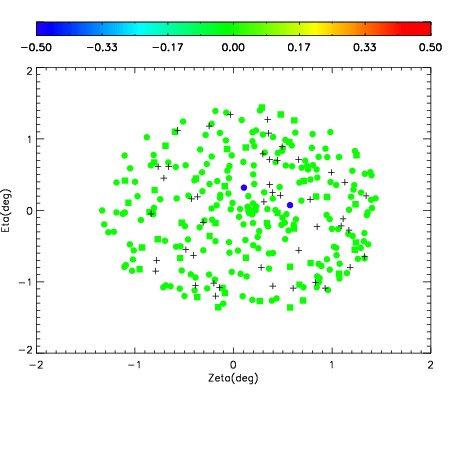
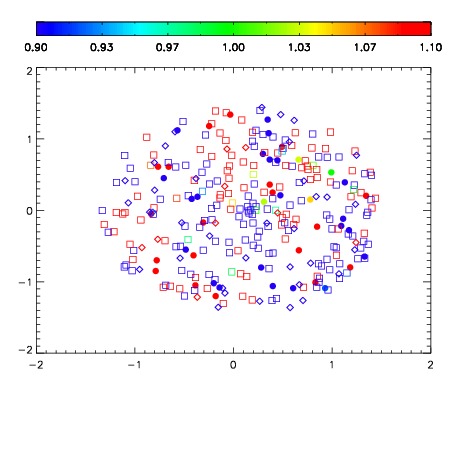
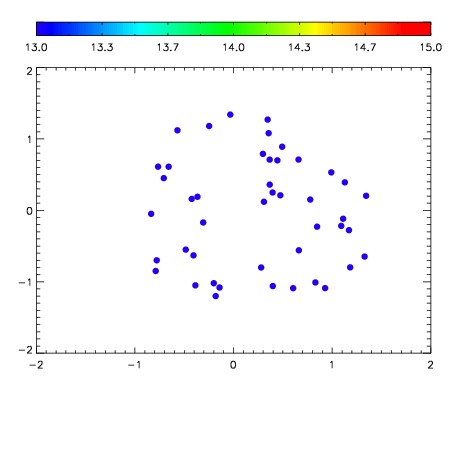

| Frame | Nreads | Zeropoints | Mag plots | Spatial mag deviation | Spatial sky 16325A emission deviations (filled: sky, open: star) | Spatial sky continuum emission | Spatial sky telluric CO2 absorption deviations (filled: H < 10) | |||||||||||||||||||||||
| 0 | 0 |
|
|
|
|
|
|
| IPAIR | NAME | SHIFT | NEWSHIFT | S/N | NAME | SHIFT | NEWSHIFT | S/N |
| 0 | 02590017 | 0.419713 | 0.00000 | 216.181 | 02590014 | 0.00189257 | 0.417820 | 207.434 |
| 1 | 02590013 | 0.419581 | 0.000131994 | 218.878 | 02590015 | -0.000428135 | 0.420141 | 212.269 |
| 2 | 02590016 | 0.417509 | 0.00220400 | 205.075 | 02590018 | 0.00343790 | 0.416275 | 198.661 |
| 3 | 02590012 | 0.416687 | 0.00302598 | 199.447 | 02590011 | 0.00000 | 0.419713 | 197.516 |