| Red | Green | Blue | |
| z | 17.64 | ||
| znorm | Inf | ||
| sky | -NaN | -Inf | -Inf |
| S/N | 5.7 | 13.8 | 14.3 |
| S/N(c) | 0.0 | 0.0 | 0.0 |
| SN(E/C) |
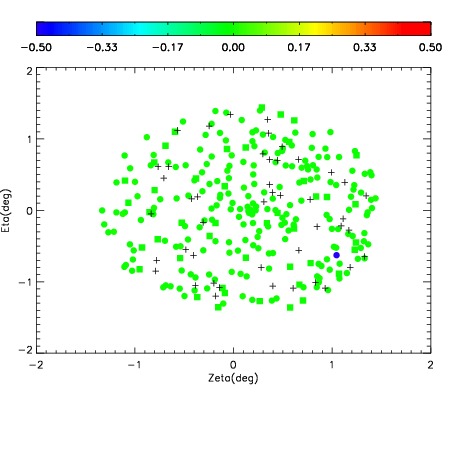
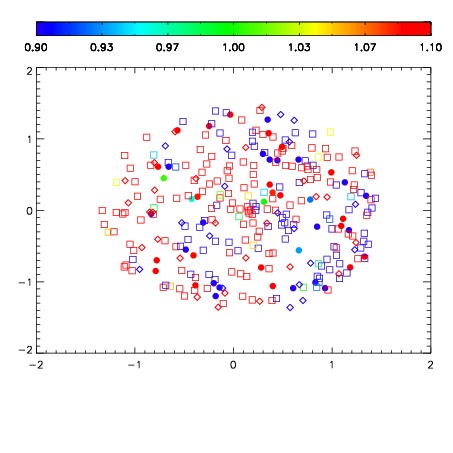
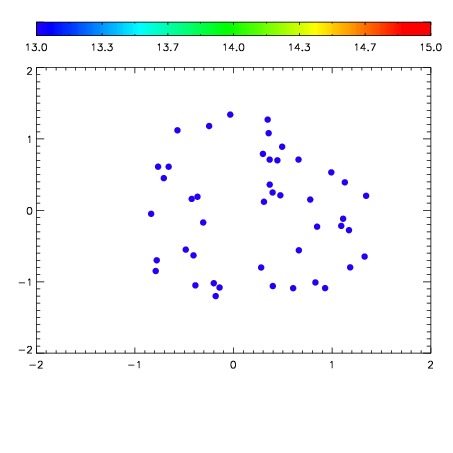

| Frame | Nreads | Zeropoints | Mag plots | Spatial mag deviation | Spatial sky 16325A emission deviations (filled: sky, open: star) | Spatial sky continuum emission | Spatial sky telluric CO2 absorption deviations (filled: H < 10) | |||||||||||||||||||||||
| 0 | 0 |
|
|
|
|
|
|
| IPAIR | NAME | SHIFT | NEWSHIFT | S/N | NAME | SHIFT | NEWSHIFT | S/N |
| 0 | 03060010 | 0.498989 | 0.00000 | 91.2356 | 03060011 | -0.000894635 | 0.499884 | 81.2853 |
| 1 | 03060009 | 0.498122 | 0.000866979 | 91.3234 | 03060008 | 0.00000 | 0.498989 | 93.1722 |
| 2 | 03060013 | 0.491842 | 0.00714698 | 77.8653 | 03060012 | -0.00303803 | 0.502027 | 79.5692 |
| 3 | 03060014 | 0.493029 | 0.00595999 | 74.2247 | 03060015 | -0.000183471 | 0.499172 | 79.1384 |