| Red | Green | Blue | |
| z | 17.64 | ||
| znorm | Inf | ||
| sky | -NaN | -NaN | -Inf |
| S/N | 27.7 | 49.9 | 52.9 |
| S/N(c) | 0.0 | 0.0 | 0.0 |
| SN(E/C) |
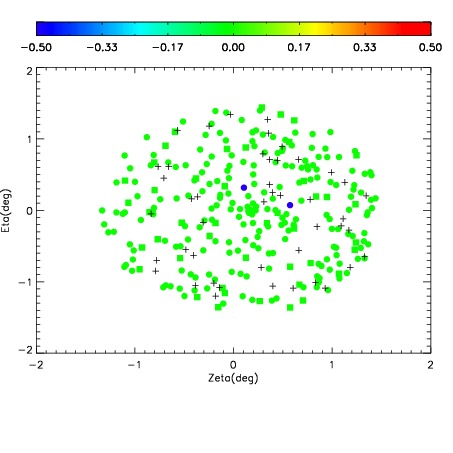
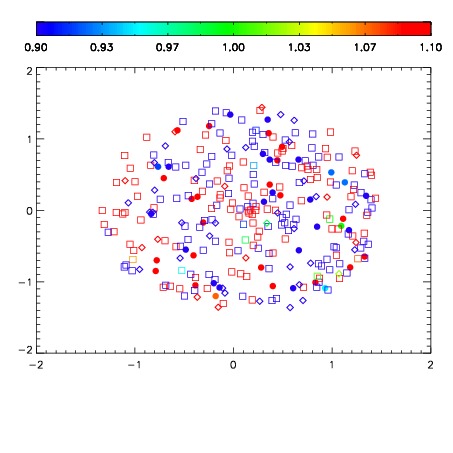
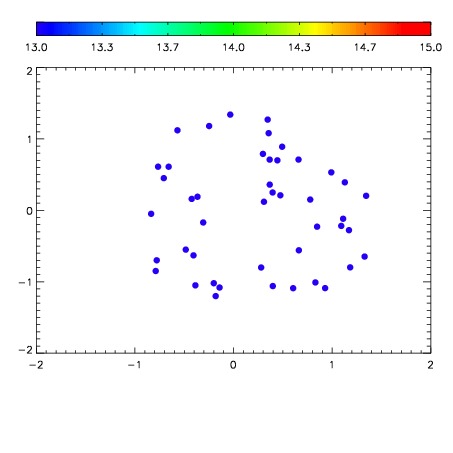

| Frame | Nreads | Zeropoints | Mag plots | Spatial mag deviation | Spatial sky 16325A emission deviations (filled: sky, open: star) | Spatial sky continuum emission | Spatial sky telluric CO2 absorption deviations (filled: H < 10) | |||||||||||||||||||||||
| 0 | 0 |
|
|
|
|
|
|
| IPAIR | NAME | SHIFT | NEWSHIFT | S/N | NAME | SHIFT | NEWSHIFT | S/N |
| 0 | 03070010 | 0.496198 | 0.00000 | 221.916 | 03070011 | 0.00156719 | 0.494631 | 223.267 |
| 1 | 03070014 | 0.495918 | 0.000279993 | 220.661 | 03070008 | 0.00000 | 0.496198 | 220.025 |
| 2 | 03070013 | 0.495761 | 0.000436991 | 219.396 | 03070012 | -0.00164600 | 0.497844 | 219.590 |
| 3 | 03070009 | 0.495673 | 0.000524998 | 216.063 | 03070015 | -0.00219296 | 0.498391 | 218.303 |