| Red | Green | Blue | |
| z | 17.64 | ||
| znorm | Inf | ||
| sky | -Inf | -Inf | -Inf |
| S/N | 28.0 | 47.4 | 54.3 |
| S/N(c) | 0.0 | 0.0 | 0.0 |
| SN(E/C) |
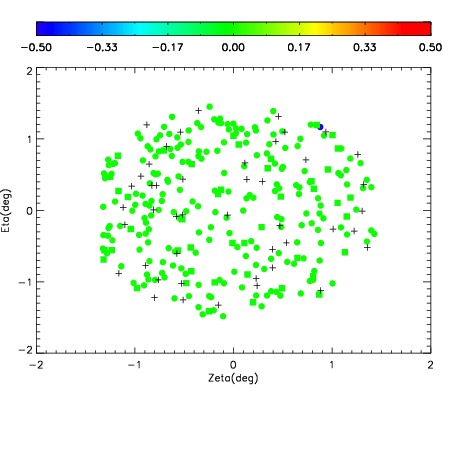
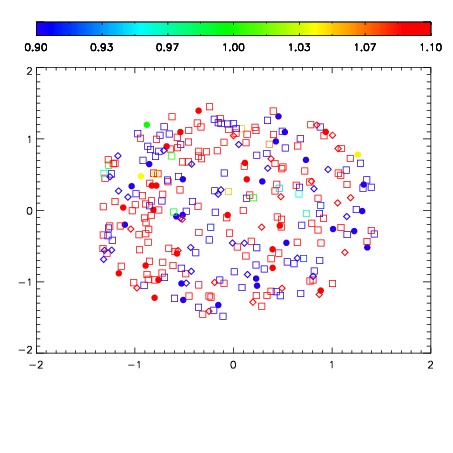
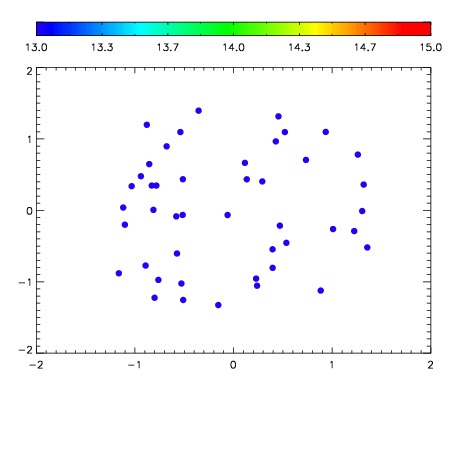

| Frame | Nreads | Zeropoints | Mag plots | Spatial mag deviation | Spatial sky 16325A emission deviations (filled: sky, open: star) | Spatial sky continuum emission | Spatial sky telluric CO2 absorption deviations (filled: H < 10) | |||||||||||||||||||||||
| 0 | 0 |
|
|
|
|
|
|
| 01730033 | 0.00000 | 152.188 |
| 01730034 | 0.00000 | 164.469 |
| 01730035 | 0.00000 | 151.116 |
| 01730036 | 0.00000 | 157.259 |
| 01730037 | 0.00000 | 158.396 |
| 01730038 | 0.00000 | 164.120 |
| 01730039 | 0.00000 | 174.163 |