| Red | Green | Blue | |
| z | 17.64 | ||
| znorm | Inf | ||
| sky | -NaN | -NaN | -Inf |
| S/N | 35.8 | 59.1 | 69.4 |
| S/N(c) | 0.0 | 0.0 | 0.0 |
| SN(E/C) |
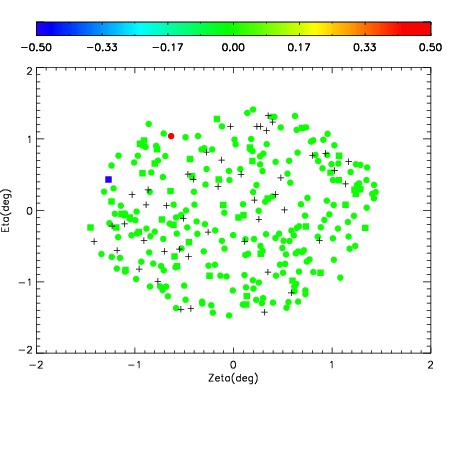
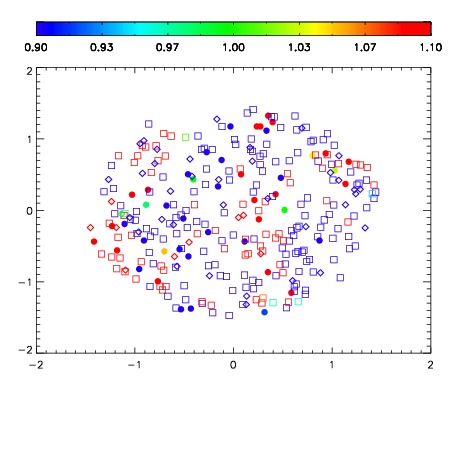
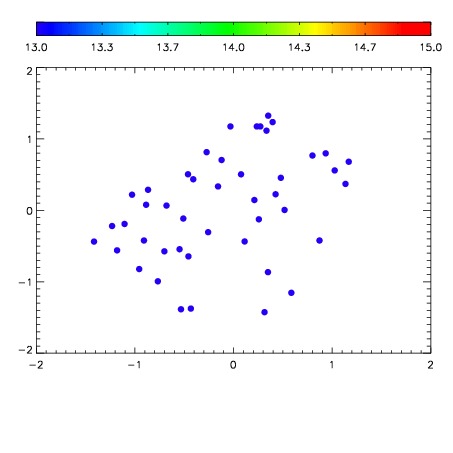

| Frame | Nreads | Zeropoints | Mag plots | Spatial mag deviation | Spatial sky 16325A emission deviations (filled: sky, open: star) | Spatial sky continuum emission | Spatial sky telluric CO2 absorption deviations (filled: H < 10) | |||||||||||||||||||||||
| 0 | 0 |
|
|
|
|
|
|
| 01660052 | 0.00000 | 194.397 |
| 01660053 | 0.00000 | 192.332 |
| 01660054 | 0.00000 | 193.881 |
| 01660055 | 0.00000 | 194.895 |
| 01660056 | 0.00000 | 202.502 |
| 01660057 | 0.00000 | 184.794 |
| 01660058 | 0.00000 | 204.284 |