| Red | Green | Blue | |
| z | 17.64 | ||
| znorm | Inf | ||
| sky | -Inf | -Inf | -Inf |
| S/N | 34.8 | 58.4 | 66.9 |
| S/N(c) | 0.0 | 0.0 | 0.0 |
| SN(E/C) |
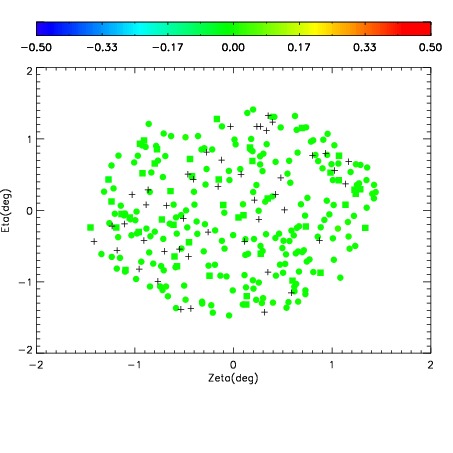
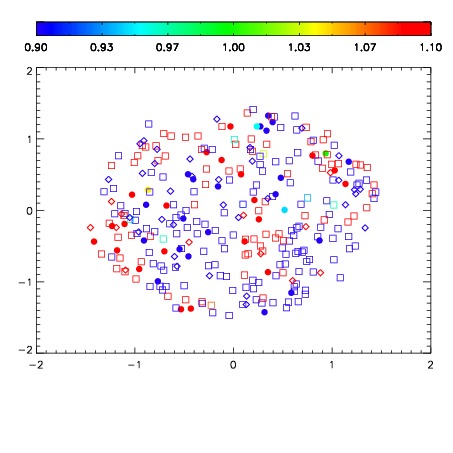
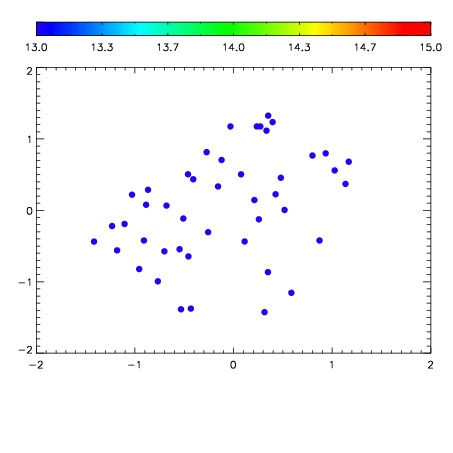

| Frame | Nreads | Zeropoints | Mag plots | Spatial mag deviation | Spatial sky 16325A emission deviations (filled: sky, open: star) | Spatial sky continuum emission | Spatial sky telluric CO2 absorption deviations (filled: H < 10) | |||||||||||||||||||||||
| 0 | 0 |
|
|
|
|
|
|
| 01960041 | 0.00000 | 194.551 |
| 01960042 | 0.00000 | 194.854 |
| 01960043 | 0.00000 | 192.182 |
| 01960044 | 0.00000 | 192.598 |
| 01960045 | 0.00000 | 194.959 |
| 01960046 | 0.00000 | 191.708 |
| 01960047 | 0.00000 | 189.326 |