| Red | Green | Blue | |
| z | 17.64 | ||
| znorm | Inf | ||
| sky | -Inf | -Inf | -Inf |
| S/N | 33.3 | 48.9 | 51.6 |
| S/N(c) | 0.0 | 0.0 | 0.0 |
| SN(E/C) |
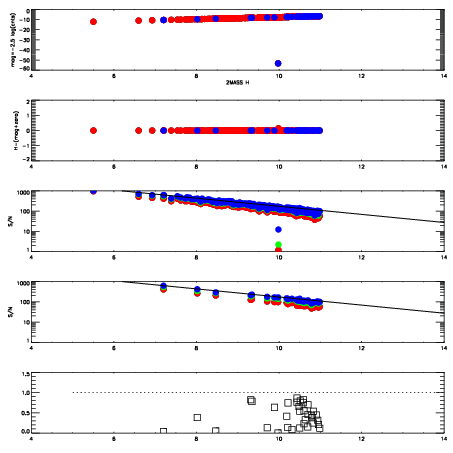
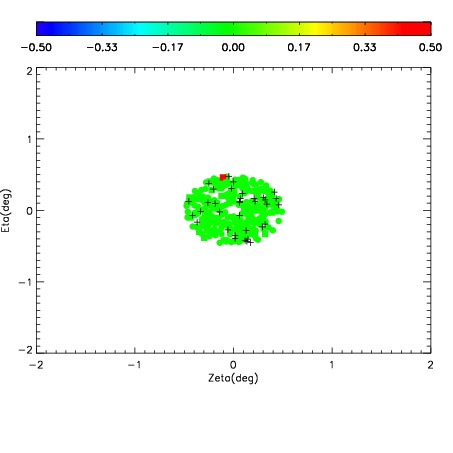
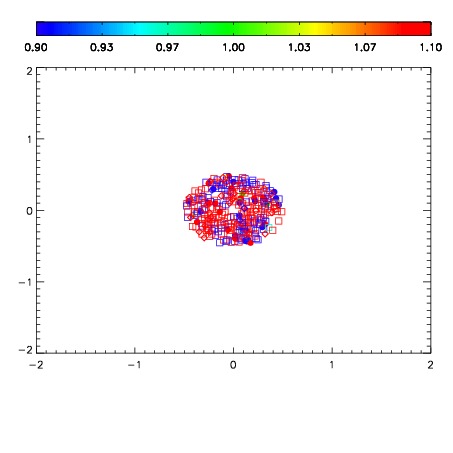


| Frame | Nreads | Zeropoints | Mag plots | Spatial mag deviation | Spatial sky 16325A emission deviations (filled: sky, open: star) | Spatial sky continuum emission | Spatial sky telluric CO2 absorption deviations (filled: H < 10) | |||||||||||||||||||||||
| 0 | 0 |
|
|
|
|
|
|
| 01700013 | 0.00000 | 193.108 |
| 01700014 | 0.00000 | 190.183 |
| 01700015 | 0.00000 | 181.077 |
| 01700016 | 0.00000 | 179.367 |
| 01700017 | 0.00000 | 188.828 |
| 01700018 | 0.00000 | 161.671 |
| 01700019 | 0.00000 | 189.968 |
| 01700020 | 0.00000 | 191.371 |