| Red | Green | Blue | |
| z | 17.64 | ||
| znorm | Inf | ||
| sky | -NaN | -Inf | -Inf |
| S/N | 25.0 | 38.1 | 41.0 |
| S/N(c) | 0.0 | 0.0 | 0.0 |
| SN(E/C) |
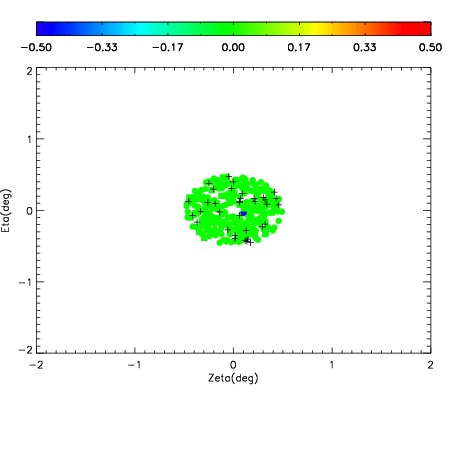
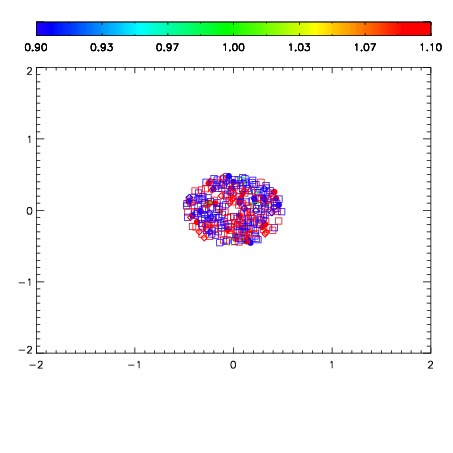
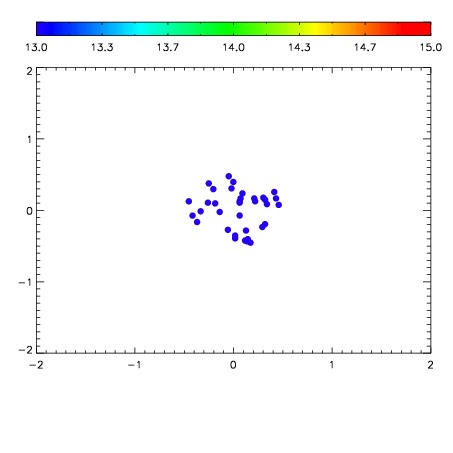

| Frame | Nreads | Zeropoints | Mag plots | Spatial mag deviation | Spatial sky 16325A emission deviations (filled: sky, open: star) | Spatial sky continuum emission | Spatial sky telluric CO2 absorption deviations (filled: H < 10) | |||||||||||||||||||||||
| 0 | 0 |
|
|
|
|
|
|
| IPAIR | NAME | SHIFT | NEWSHIFT | S/N | NAME | SHIFT | NEWSHIFT | S/N |
| 0 | 12660054 | 0.486915 | 0.00000 | 178.568 | 12660055 | 0.00141846 | 0.485497 | 174.452 |
| 1 | 12660049 | 0.482028 | 0.00488698 | 209.940 | 12660048 | 0.00000 | 0.486915 | 226.332 |
| 2 | 12660053 | 0.484081 | 0.00283399 | 183.806 | 12660052 | -0.00128203 | 0.488197 | 186.710 |
| 3 | 12660050 | 0.483840 | 0.00307500 | 143.129 | 12660051 | -0.00174895 | 0.488664 | 141.369 |