| Red | Green | Blue | |
| z | 17.63 | ||
| znorm | Inf | ||
| sky | -NaN | -NaN | -Inf |
| S/N | 41.3 | 60.5 | 69.9 |
| S/N(c) | 0.0 | 0.0 | 0.0 |
| SN(E/C) |
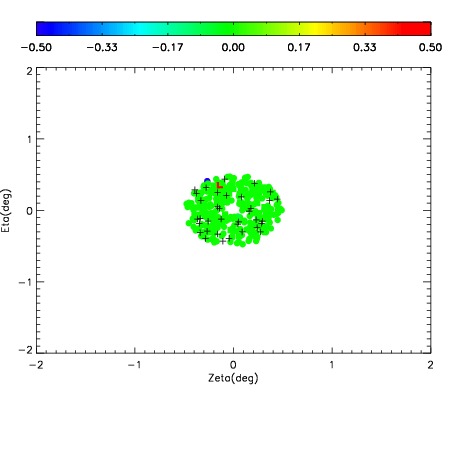
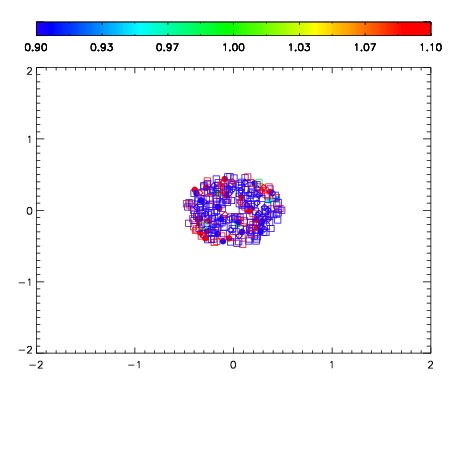
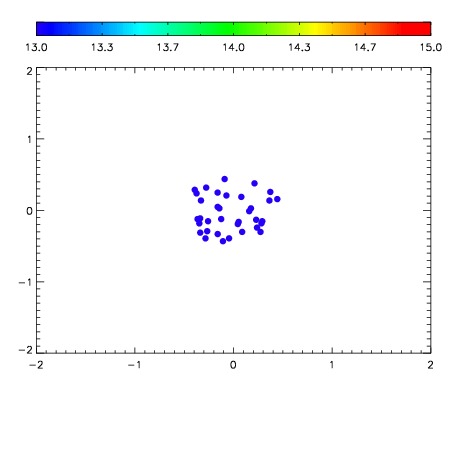

| Frame | Nreads | Zeropoints | Mag plots | Spatial mag deviation | Spatial sky 16325A emission deviations (filled: sky, open: star) | Spatial sky continuum emission | Spatial sky telluric CO2 absorption deviations (filled: H < 10) | |||||||||||||||||||||||
| 0 | 0 |
|
|
|
|
|
|
| 01710064 | 0.00000 | 150.043 |
| 01710065 | 0.00000 | 164.129 |
| 01710066 | 0.00000 | 155.501 |
| 01710067 | 0.00000 | 149.340 |
| 01710068 | 0.00000 | 140.471 |
| 01710069 | 0.00000 | 147.222 |
| 01710070 | 0.00000 | 149.546 |
| 01710071 | 0.00000 | 124.403 |