| Red | Green | Blue | |
| z | 17.64 | ||
| znorm | Inf | ||
| sky | -NaN | -NaN | -Inf |
| S/N | 25.1 | 39.2 | 42.4 |
| S/N(c) | 0.0 | 0.0 | 0.0 |
| SN(E/C) |
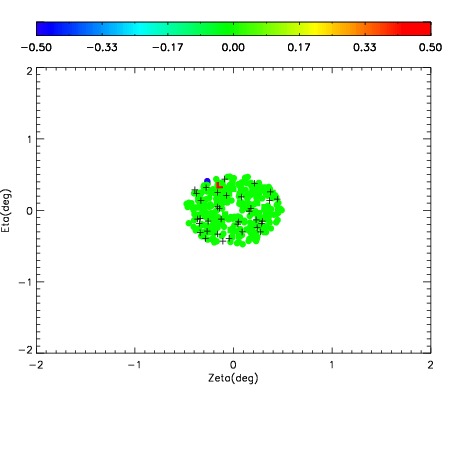
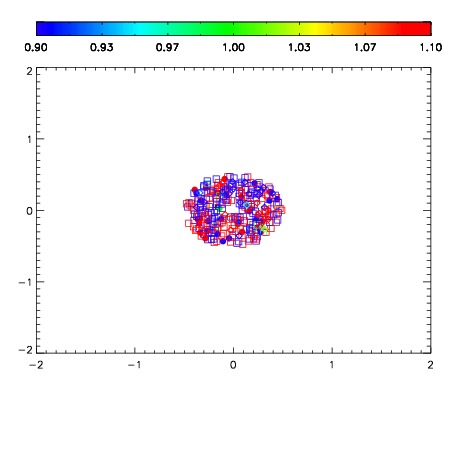
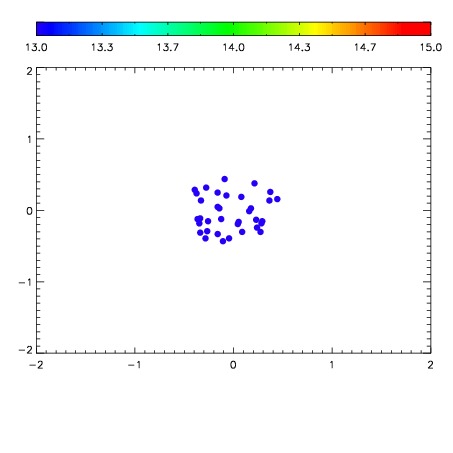

| Frame | Nreads | Zeropoints | Mag plots | Spatial mag deviation | Spatial sky 16325A emission deviations (filled: sky, open: star) | Spatial sky continuum emission | Spatial sky telluric CO2 absorption deviations (filled: H < 10) | |||||||||||||||||||||||
| 0 | 0 |
|
|
|
|
|
|
| IPAIR | NAME | SHIFT | NEWSHIFT | S/N | NAME | SHIFT | NEWSHIFT | S/N |
| 0 | 12660043 | 0.482778 | 0.00000 | 158.748 | 12660044 | -0.00262526 | 0.485403 | 168.904 |
| 1 | 12660042 | 0.481181 | 0.00159702 | 137.185 | 12660041 | -0.00358819 | 0.486366 | 145.253 |
| 2 | 12660039 | 0.479603 | 0.00317502 | 125.442 | 12660037 | 0.00000 | 0.482778 | 128.768 |
| 3 | 12660038 | 0.481162 | 0.00161600 | 125.441 | 12660040 | -0.00301577 | 0.485794 | 128.491 |