| Red | Green | Blue | |
| z | 17.64 | ||
| znorm | Inf | ||
| sky | -Inf | -Inf | -Inf |
| S/N | 33.1 | 48.8 | 51.1 |
| S/N(c) | 0.0 | 0.0 | 0.0 |
| SN(E/C) |

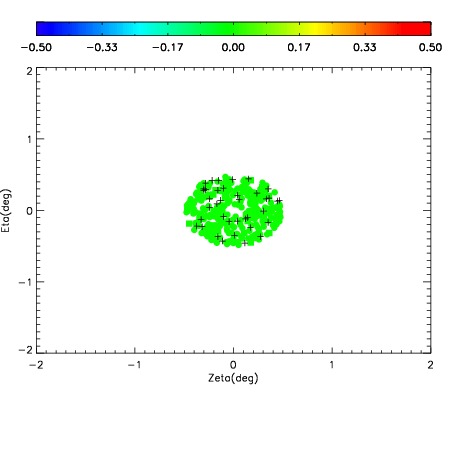
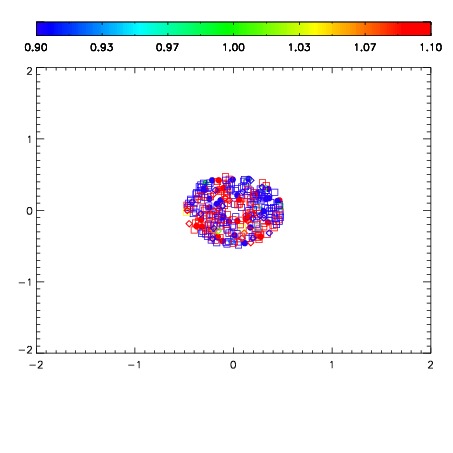
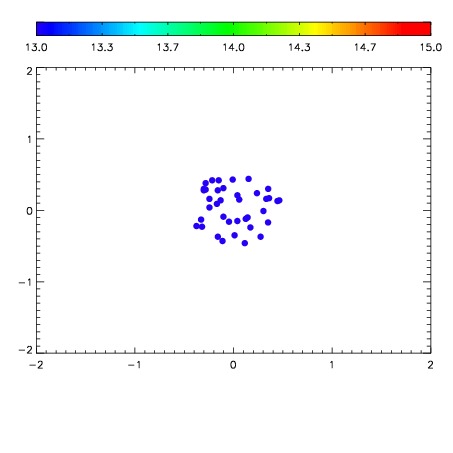

| Frame | Nreads | Zeropoints | Mag plots | Spatial mag deviation | Spatial sky 16325A emission deviations (filled: sky, open: star) | Spatial sky continuum emission | Spatial sky telluric CO2 absorption deviations (filled: H < 10) | |||||||||||||||||||||||
| 0 | 0 |
|
|
|
|
|
|
| 01720067 | 0.00000 | 153.701 |
| 01720068 | 0.00000 | 154.908 |
| 01720069 | 0.00000 | 150.397 |
| 01720070 | 0.00000 | 149.823 |
| 01720071 | 0.00000 | 161.970 |
| 01720072 | 0.00000 | 145.673 |
| 01720073 | 0.00000 | 136.697 |