| Red | Green | Blue | |
| z | 17.64 | ||
| znorm | Inf | ||
| sky | -Inf | -Inf | -Inf |
| S/N | 33.2 | 48.5 | 49.2 |
| S/N(c) | 0.0 | 0.0 | 0.0 |
| SN(E/C) |
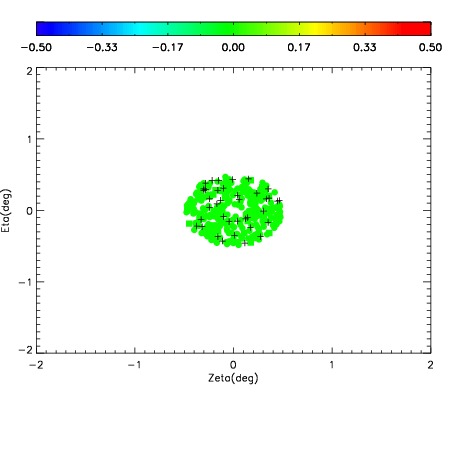
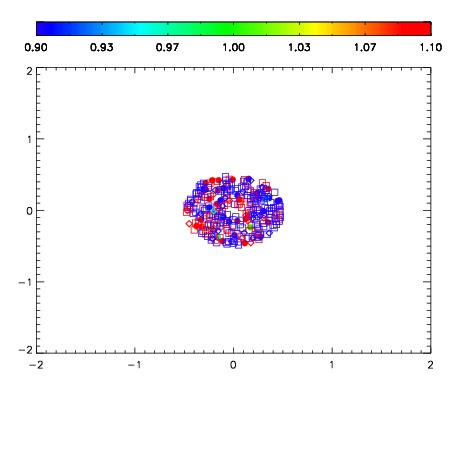


| Frame | Nreads | Zeropoints | Mag plots | Spatial mag deviation | Spatial sky 16325A emission deviations (filled: sky, open: star) | Spatial sky continuum emission | Spatial sky telluric CO2 absorption deviations (filled: H < 10) | |||||||||||||||||||||||
| 0 | 0 |
|
|
|
|
|
|
| IPAIR | NAME | SHIFT | NEWSHIFT | S/N | NAME | SHIFT | NEWSHIFT | S/N |
| 0 | 12710030 | 0.481688 | 0.00000 | 185.939 | 12710028 | 0.00000 | 0.481688 | 184.456 |
| 1 | 12710029 | 0.481265 | 0.000422984 | 194.678 | 12710032 | -0.00415187 | 0.485840 | 200.030 |
| 2 | 12710034 | 0.481460 | 0.000227988 | 193.999 | 12710035 | -0.00391718 | 0.485605 | 199.295 |
| 3 | 12710033 | 0.480644 | 0.00104401 | 190.554 | 12710031 | -0.00302157 | 0.484710 | 197.631 |