| Red | Green | Blue | |
| z | 17.64 | ||
| znorm | Inf | ||
| sky | -Inf | -NaN | -Inf |
| S/N | 27.2 | 40.1 | 41.5 |
| S/N(c) | 0.0 | 0.0 | 0.0 |
| SN(E/C) |
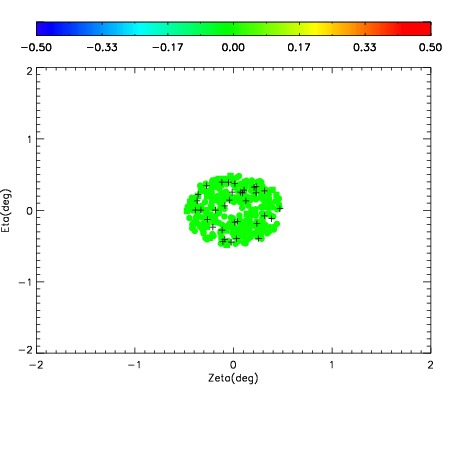
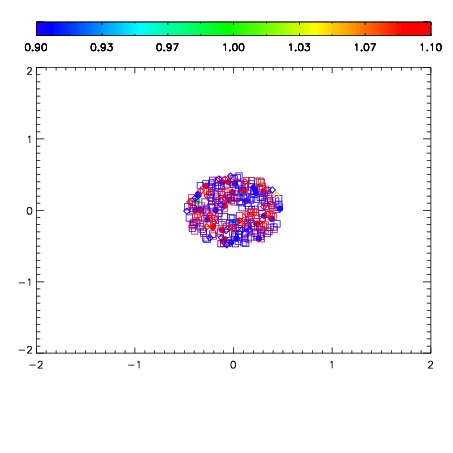
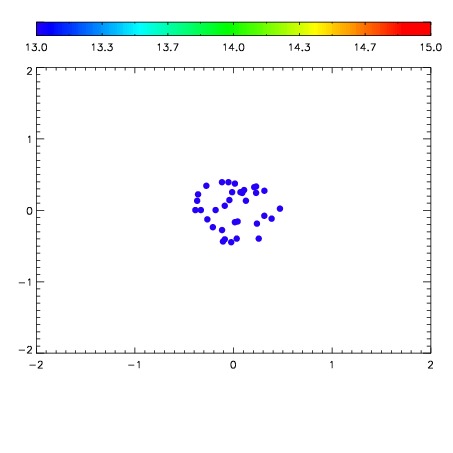

| Frame | Nreads | Zeropoints | Mag plots | Spatial mag deviation | Spatial sky 16325A emission deviations (filled: sky, open: star) | Spatial sky continuum emission | Spatial sky telluric CO2 absorption deviations (filled: H < 10) | |||||||||||||||||||||||
| 0 | 0 |
|
|
|
|
|
|
| IPAIR | NAME | SHIFT | NEWSHIFT | S/N | NAME | SHIFT | NEWSHIFT | S/N |
| 0 | 12710023 | 0.490145 | 0.00000 | 173.655 | 12710024 | 0.00122584 | 0.488919 | 176.104 |
| 1 | 12710022 | 0.489822 | 0.000322998 | 173.822 | 12710020 | 0.000147995 | 0.489997 | 181.220 |
| 2 | 12710019 | 0.487825 | 0.00231999 | 170.758 | 12710021 | 7.51668e-05 | 0.490070 | 174.852 |
| 3 | 12710018 | 0.488153 | 0.00199199 | 150.436 | 12710017 | 0.00000 | 0.490145 | 143.927 |