| Red | Green | Blue | |
| z | 17.64 | ||
| znorm | Inf | ||
| sky | -NaN | -NaN | -Inf |
| S/N | 36.5 | 49.8 | 52.7 |
| S/N(c) | 0.0 | 0.0 | 0.0 |
| SN(E/C) |
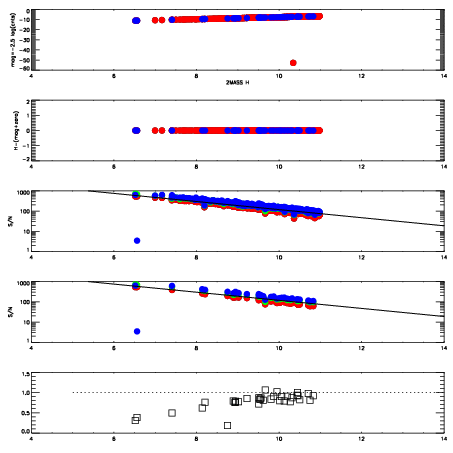
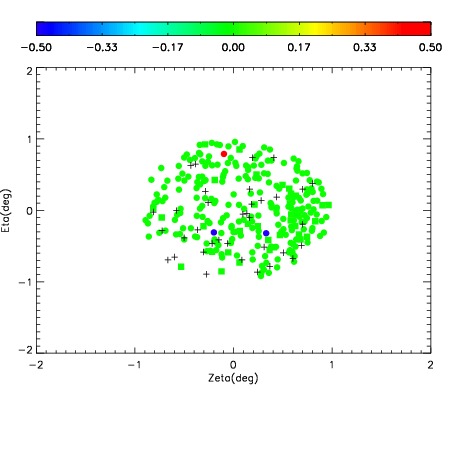
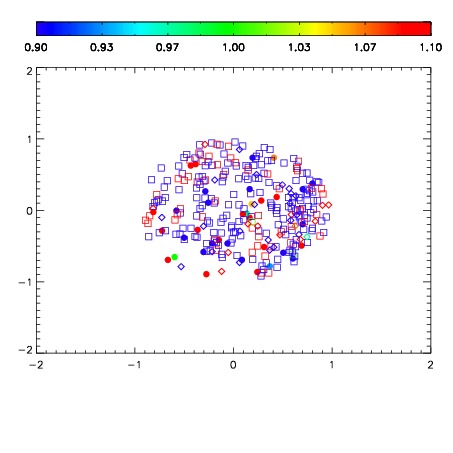


| Frame | Nreads | Zeropoints | Mag plots | Spatial mag deviation | Spatial sky 16325A emission deviations (filled: sky, open: star) | Spatial sky continuum emission | Spatial sky telluric CO2 absorption deviations (filled: H < 10) | |||||||||||||||||||||||
| 0 | 0 |
|
|
|
|
|
|
| IPAIR | NAME | SHIFT | NEWSHIFT | S/N | NAME | SHIFT | NEWSHIFT | S/N |
| 0 | 12730035 | 0.480700 | 0.00000 | 198.929 | 12730036 | -0.00169767 | 0.482398 | 200.184 |
| 1 | 12730039 | 0.479636 | 0.00106397 | 193.925 | 12730040 | -0.00216181 | 0.482862 | 200.102 |
| 2 | 12730034 | 0.480598 | 0.000101984 | 193.837 | 12730037 | -0.00256316 | 0.483263 | 189.317 |
| 3 | 12730038 | 0.479130 | 0.00156999 | 188.916 | 12730033 | 0.00000 | 0.480700 | 188.719 |