| Red | Green | Blue | |
| z | 17.64 | ||
| znorm | Inf | ||
| sky | -Inf | -Inf | -Inf |
| S/N | 34.0 | 51.0 | 54.7 |
| S/N(c) | 0.0 | 0.0 | 0.0 |
| SN(E/C) |

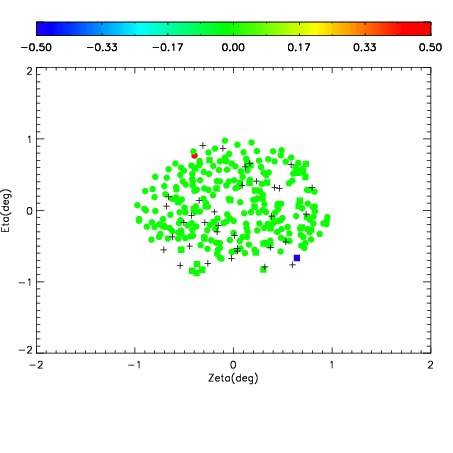
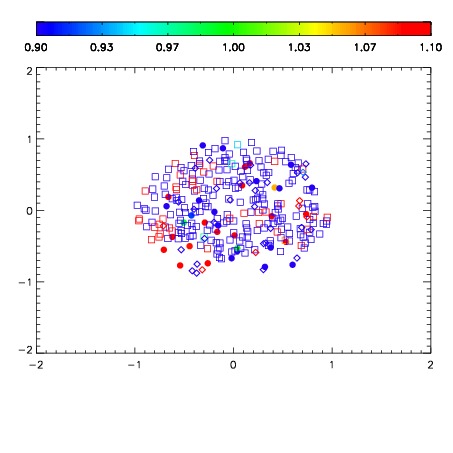


| Frame | Nreads | Zeropoints | Mag plots | Spatial mag deviation | Spatial sky 16325A emission deviations (filled: sky, open: star) | Spatial sky continuum emission | Spatial sky telluric CO2 absorption deviations (filled: H < 10) | |||||||||||||||||||||||
| 0 | 0 |
|
|
|
|
|
|
| IPAIR | NAME | SHIFT | NEWSHIFT | S/N | NAME | SHIFT | NEWSHIFT | S/N |
| 0 | 12730050 | 0.483344 | 0.00000 | 219.238 | 12730048 | -0.000467096 | 0.483811 | 203.069 |
| 1 | 12730049 | 0.482967 | 0.000376999 | 239.140 | 12730044 | 0.00000 | 0.483344 | 237.442 |
| 2 | 12730045 | 0.479442 | 0.00390199 | 236.535 | 12730047 | -0.00184919 | 0.485193 | 236.950 |
| 3 | 12730046 | 0.480383 | 0.00296098 | 232.306 | 12730051 | -0.000845293 | 0.484189 | 227.331 |