| Red | Green | Blue | |
| z | 17.64 | ||
| znorm | Inf | ||
| sky | -NaN | -NaN | -Inf |
| S/N | 31.8 | 51.6 | 55.3 |
| S/N(c) | 0.0 | 0.0 | 0.0 |
| SN(E/C) |

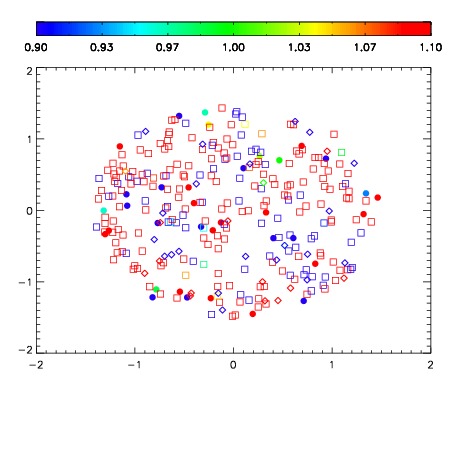
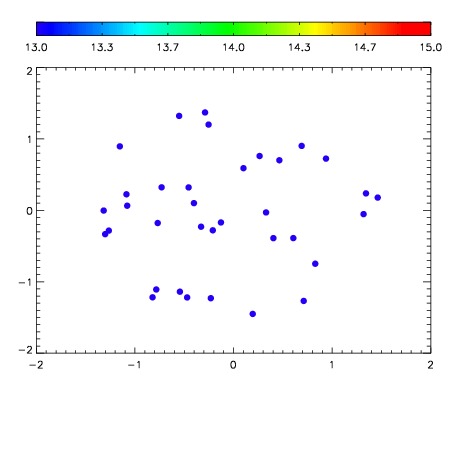

| Frame | Nreads | Zeropoints | Mag plots | Spatial mag deviation | Spatial sky 16325A emission deviations (filled: sky, open: star) | Spatial sky continuum emission | Spatial sky telluric CO2 absorption deviations (filled: H < 10) | |||||||||||||||||||||||
| 0 | 0 |
|
|
|
|
|
|
| 01720086 | 0.00000 | 167.949 |
| 01720087 | 0.00000 | 173.889 |
| 01720088 | 0.00000 | 184.060 |
| 01720089 | 0.00000 | 199.386 |
| 01720090 | 0.00000 | 200.764 |
| 01720091 | 0.00000 | 201.533 |