| Red | Green | Blue | |
| z | 17.64 | ||
| znorm | Inf | ||
| sky | -NaN | -Inf | -Inf |
| S/N | 36.2 | 60.4 | 65.4 |
| S/N(c) | 0.0 | 0.0 | 0.0 |
| SN(E/C) |
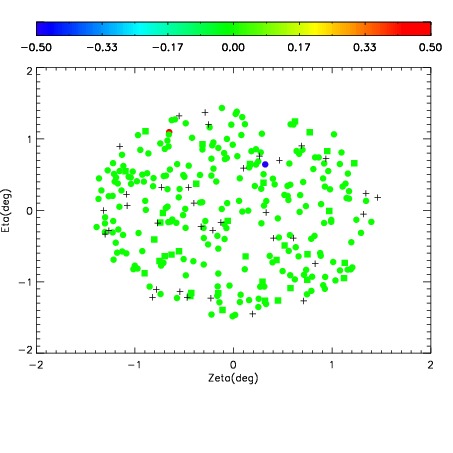

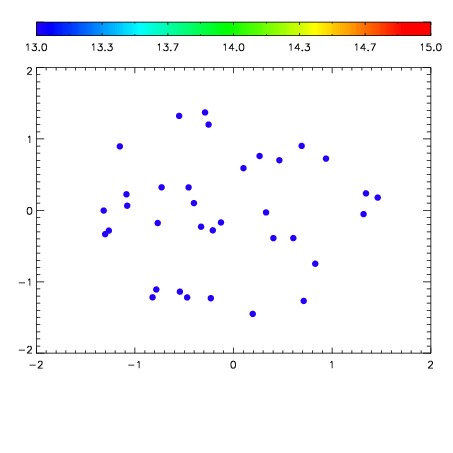

| Frame | Nreads | Zeropoints | Mag plots | Spatial mag deviation | Spatial sky 16325A emission deviations (filled: sky, open: star) | Spatial sky continuum emission | Spatial sky telluric CO2 absorption deviations (filled: H < 10) | |||||||||||||||||||||||
| 0 | 0 |
|
|
|
|
|
|
| 01740013 | 0.00000 | 174.462 |
| 01740014 | 0.00000 | 175.642 |
| 01740015 | 0.00000 | 177.009 |
| 01740016 | 0.00000 | 183.249 |
| 01740017 | 0.00000 | 179.928 |
| 01740018 | 0.00000 | 172.758 |
| 01740019 | 0.00000 | 175.903 |
| 01740020 | 0.00000 | 184.887 |