| Red | Green | Blue | |
| z | 17.64 | ||
| znorm | Inf | ||
| sky | -Inf | -Inf | -Inf |
| S/N | 32.0 | 53.5 | 60.2 |
| S/N(c) | 0.0 | 0.0 | 0.0 |
| SN(E/C) |
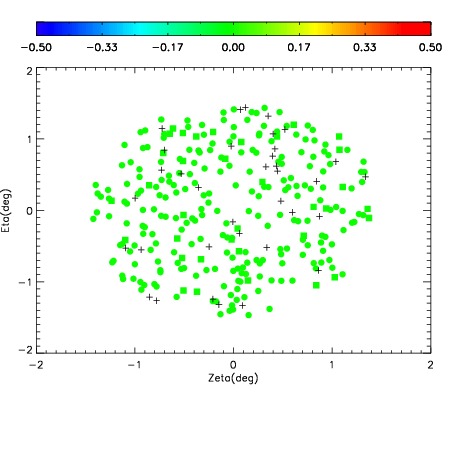
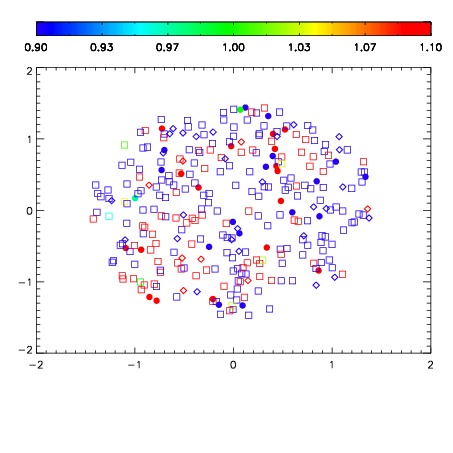
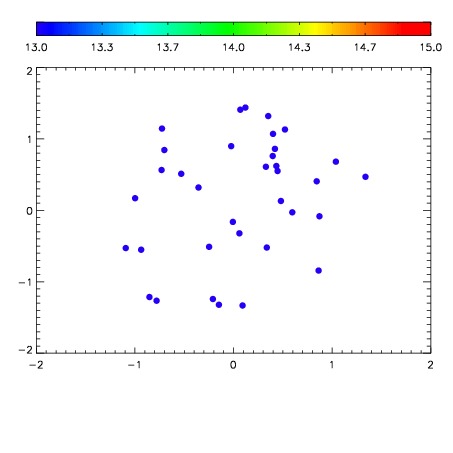

| Frame | Nreads | Zeropoints | Mag plots | Spatial mag deviation | Spatial sky 16325A emission deviations (filled: sky, open: star) | Spatial sky continuum emission | Spatial sky telluric CO2 absorption deviations (filled: H < 10) | |||||||||||||||||||||||
| 0 | 0 |
|
|
|
|
|
|
| 01750012 | 0.00000 | 251.925 |
| 01750017 | 0.00000 | 250.754 |
| 01750018 | 0.00000 | 250.633 |
| 01750019 | 0.00000 | 247.189 |
| 01750020 | 0.00000 | 235.869 |
| 01750021 | 0.00000 | 239.099 |