| Red | Green | Blue | |
| z | 17.64 | ||
| znorm | Inf | ||
| sky | -NaN | -Inf | -Inf |
| S/N | 46.0 | 68.8 | 75.9 |
| S/N(c) | 0.0 | 0.0 | 0.0 |
| SN(E/C) |
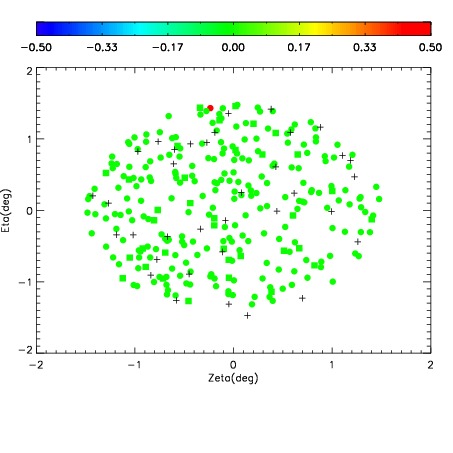
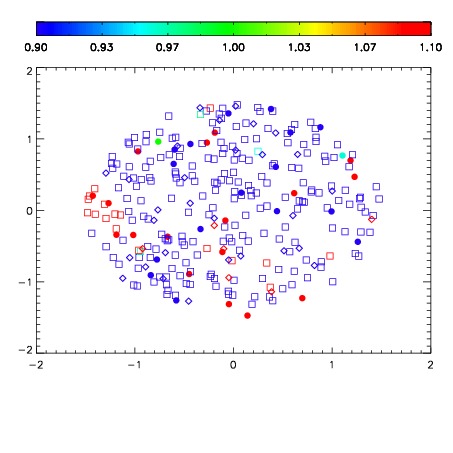
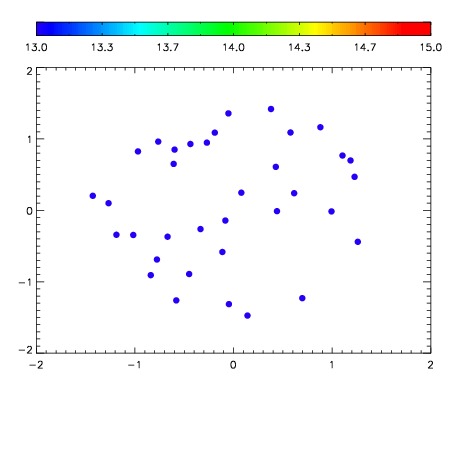

| Frame | Nreads | Zeropoints | Mag plots | Spatial mag deviation | Spatial sky 16325A emission deviations (filled: sky, open: star) | Spatial sky continuum emission | Spatial sky telluric CO2 absorption deviations (filled: H < 10) | |||||||||||||||||||||||
| 0 | 0 |
|
|
|
|
|
|
| 01980063 | 0.00000 | 170.892 |
| 01980064 | 0.00000 | 161.027 |
| 01980065 | 0.00000 | 159.360 |
| 01980066 | 0.00000 | 161.267 |
| 01980067 | 0.00000 | 161.076 |
| 01980068 | 0.00000 | 163.165 |
| 01980069 | 0.00000 | 158.253 |
| 01980070 | 0.00000 | 157.535 |
| 01980071 | 0.00000 | 148.712 |