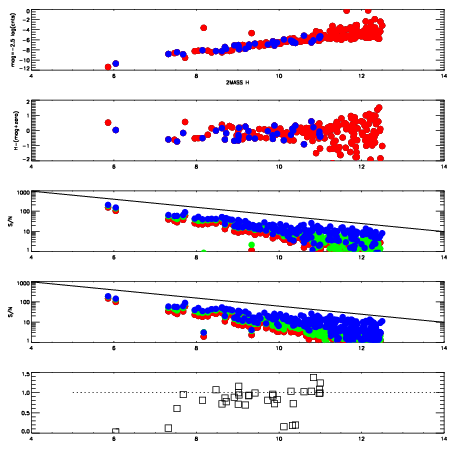
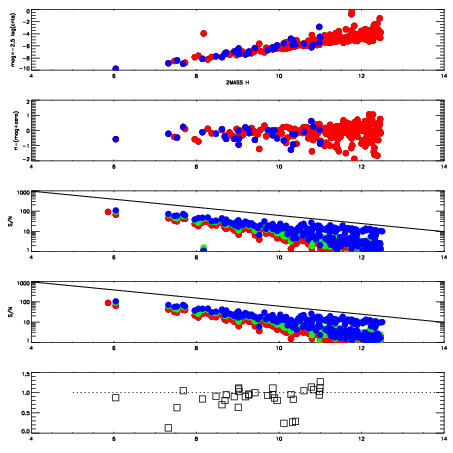
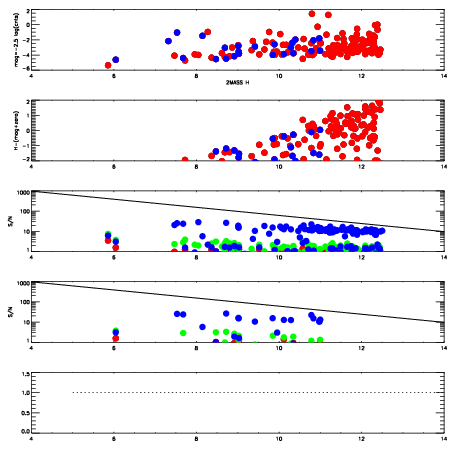
| Frame | Nreads | Zeropoints | Mag plots
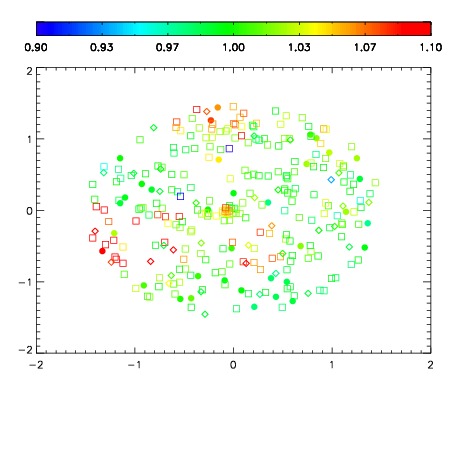
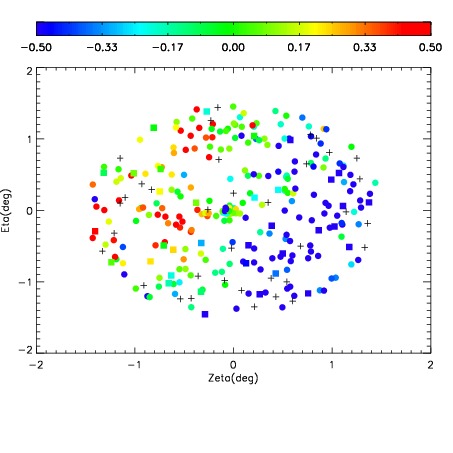
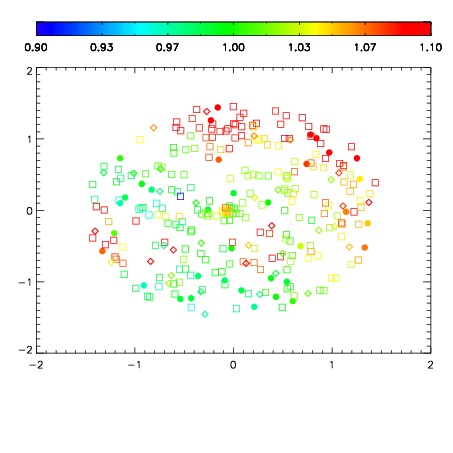
| Spatial mag deviation
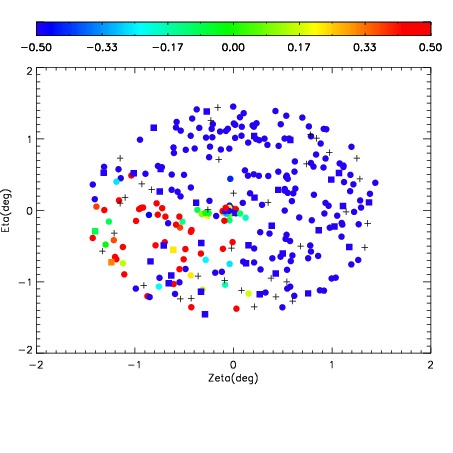
| Spatial sky 16325A emission deviations (filled: sky, open: star)
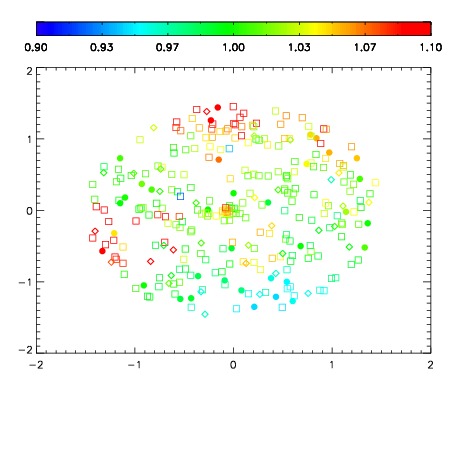
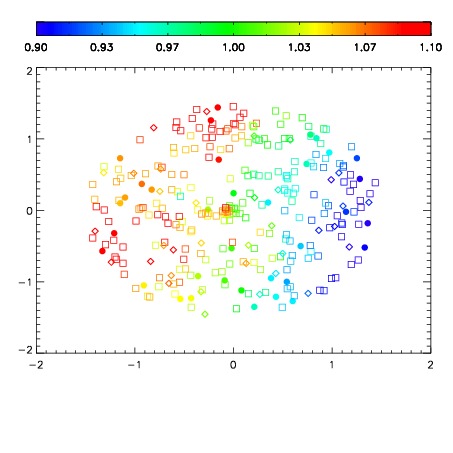
| Spatial sky continuum emission
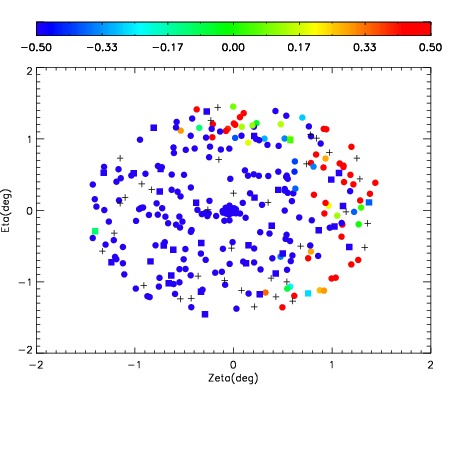
| Spatial sky telluric CO2 absorption deviations (filled: H < 10)
|
| 1970052
| 50
| | Red | Green | Blue
| | z | | 17.43
| | znorm | | 13.19
| | sky | 11.6 | 11.5 | 11.5
| | S/N | 2.5 | 3.8 | 3.5
| | S/N(c) | 2.2 | 3.7 | 4.8
| | SN(E/C) 0.76
|
| 
| 
| 
| 
| 
|
| 1970053
| 50
| | Red | Green | Blue
| | z | | 16.70
| | znorm | | 12.46
| | sky | 11.1 | 11.1 | 11.0
| | S/N | 0.0 | 0.6 | -1.3
| | S/N(c) | 1.3 | 2.1 | 2.8
| | SN(E/C) 0.92
|
| 
| 
| 
| 
| 
|
| 1970054
| 50
| | Red | Green | Blue
| | z | | 16.38
| | znorm | | 12.14
| | sky | 12.0 | 11.9 | 11.9
| | S/N | 1.3 | 2.0 | 2.2
| | S/N(c) | 1.0 | 1.6 | 2.0
| | SN(E/C) 0.94
|
| 
| 
| 
| 
| 
|
| 1970055
| 50
| | Red | Green | Blue
| | z | | 14.38
| | znorm | | 10.13
| | sky | 13.1 | 13.0 | 13.1
| | S/N | -0.0 | -0.2 | -0.1
| | S/N(c) | 0.0 | 0.0 | 0.0
| | SN(E/C) 5.42
|
| 
| 
| 
| 
| 
|
| 1970057
| 50
| | Red | Green | Blue
| | z | | 16.84
| | znorm | | 12.59
| | sky | 11.4 | 11.3 | 11.3
| | S/N | -0.4 | -0.4 | 0.4
| | S/N(c) | 0.9 | 1.4 | 1.7
| | SN(E/C) 0.84
|
| 
| 
| 
| 
| 
|