| Red | Green | Blue | |
| z | 17.64 | ||
| znorm | Inf | ||
| sky | -NaN | -Inf | -Inf |
| S/N | 28.4 | 47.8 | 58.3 |
| S/N(c) | 0.0 | 0.0 | 0.0 |
| SN(E/C) |
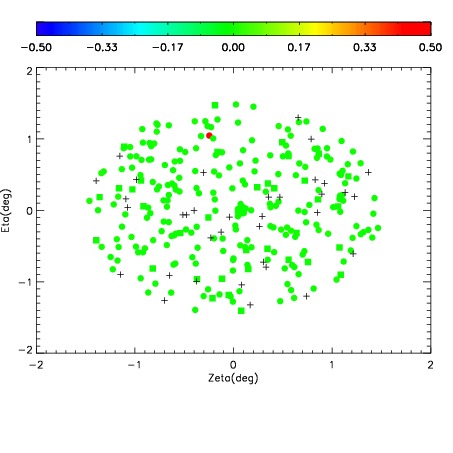
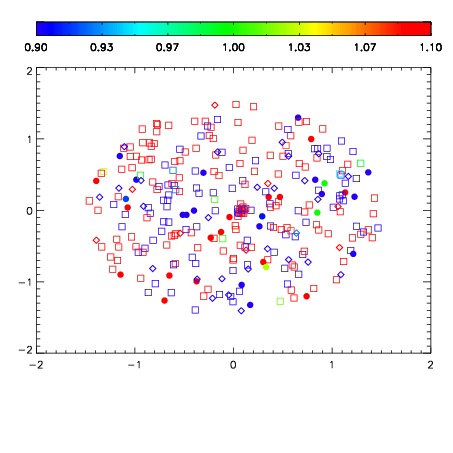


| Frame | Nreads | Zeropoints | Mag plots | Spatial mag deviation | Spatial sky 16325A emission deviations (filled: sky, open: star) | Spatial sky continuum emission | Spatial sky telluric CO2 absorption deviations (filled: H < 10) | |||||||||||||||||||||||
| 0 | 0 |
|
|
|
|
|
|
| 01900095 | 0.00000 | 167.210 |
| 01900096 | 0.00000 | 165.093 |
| 01900097 | 0.00000 | 167.948 |
| 01900098 | 0.00000 | 173.806 |
| 01900099 | 0.00000 | 180.059 |
| 01900100 | 0.00000 | 184.621 |