| Red | Green | Blue | |
| z | 17.64 | ||
| znorm | Inf | ||
| sky | -Inf | -NaN | -Inf |
| S/N | 23.5 | 42.2 | 48.9 |
| S/N(c) | 0.0 | 0.0 | 0.0 |
| SN(E/C) |

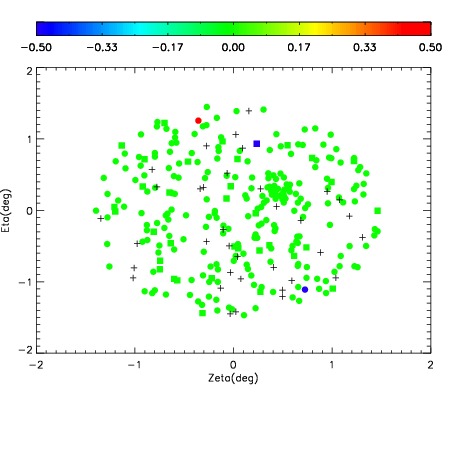
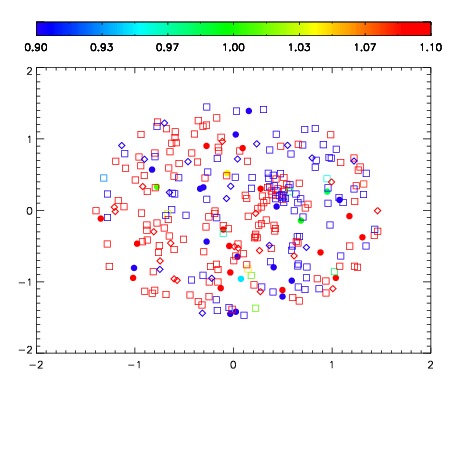
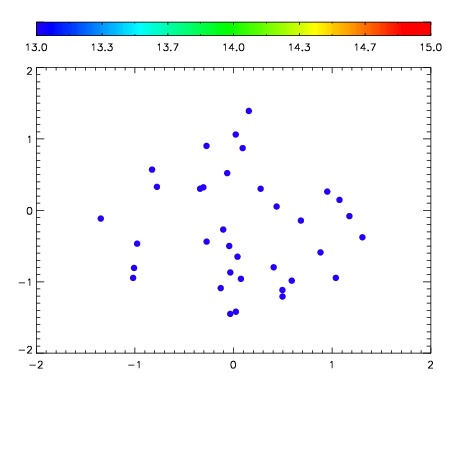

| Frame | Nreads | Zeropoints | Mag plots | Spatial mag deviation | Spatial sky 16325A emission deviations (filled: sky, open: star) | Spatial sky continuum emission | Spatial sky telluric CO2 absorption deviations (filled: H < 10) | |||||||||||||||||||||||
| 0 | 0 |
|
|
|
|
|
|
| IPAIR | NAME | SHIFT | NEWSHIFT | S/N | NAME | SHIFT | NEWSHIFT | S/N |
| 0 | 03120038 | 0.496361 | 0.00000 | 205.142 | 03120039 | 0.00389907 | 0.492462 | 181.775 |
| 1 | 03120042 | 0.494739 | 0.00162199 | 214.355 | 03120036 | 0.00000 | 0.496361 | 207.014 |
| 2 | 03120037 | 0.495195 | 0.00116599 | 213.084 | 03120043 | 0.00146423 | 0.494897 | 204.775 |
| 3 | 03120041 | 0.493564 | 0.00279698 | 190.141 | 03120040 | 0.000969990 | 0.495391 | 172.972 |