| Red | Green | Blue | |
| z | 17.63 | ||
| znorm | Inf | ||
| sky | -NaN | -NaN | -Inf |
| S/N | 27.2 | 47.6 | 50.1 |
| S/N(c) | 0.0 | 0.0 | 0.0 |
| SN(E/C) |

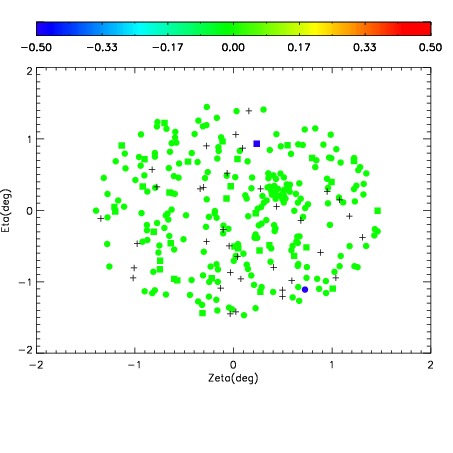
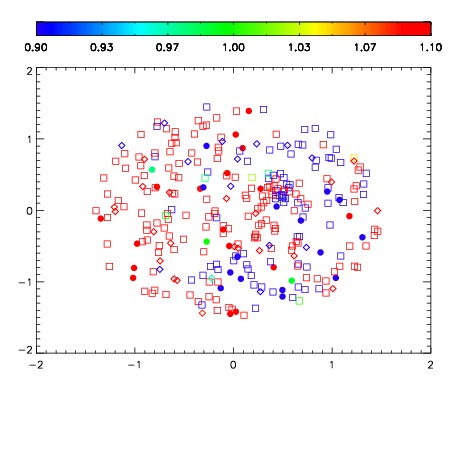
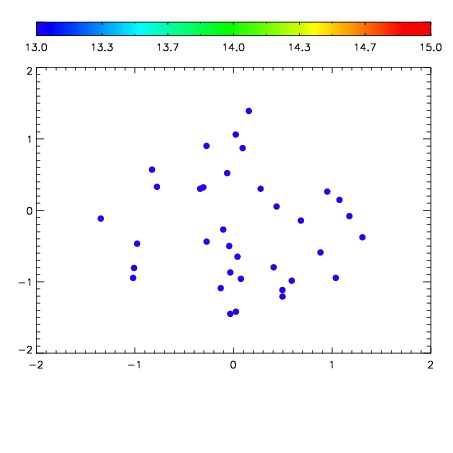

| Frame | Nreads | Zeropoints | Mag plots | Spatial mag deviation | Spatial sky 16325A emission deviations (filled: sky, open: star) | Spatial sky continuum emission | Spatial sky telluric CO2 absorption deviations (filled: H < 10) | |||||||||||||||||||||||
| 0 | 0 |
|
|
|
|
|
|
| IPAIR | NAME | SHIFT | NEWSHIFT | S/N | NAME | SHIFT | NEWSHIFT | S/N |
| 0 | 10810017 | 0.488968 | 0.00000 | 215.817 | 10810014 | -0.00127038 | 0.490238 | 215.783 |
| 1 | 10810016 | 0.488814 | 0.000154018 | 218.490 | 10810018 | -0.00144982 | 0.490418 | 216.851 |
| 2 | 10810013 | 0.486764 | 0.00220400 | 215.264 | 10810015 | -0.000984678 | 0.489953 | 215.672 |
| 3 | 10810012 | 0.486524 | 0.00244403 | 210.994 | 10810011 | 0.00000 | 0.488968 | 199.794 |