| Red | Green | Blue | |
| z | 17.64 | ||
| znorm | Inf | ||
| sky | -NaN | -NaN | -Inf |
| S/N | 28.3 | 48.0 | 52.2 |
| S/N(c) | 0.0 | 0.0 | 0.0 |
| SN(E/C) |

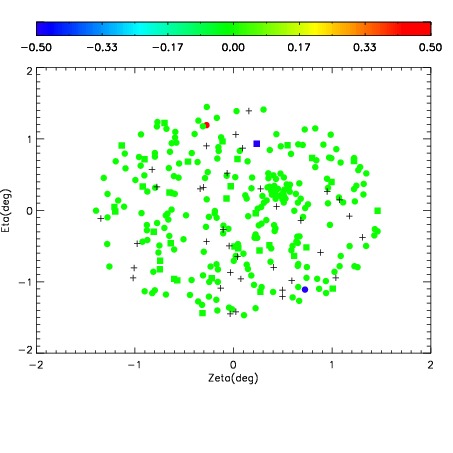
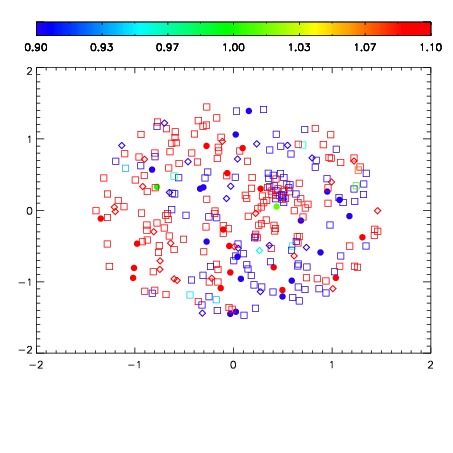


| Frame | Nreads | Zeropoints | Mag plots | Spatial mag deviation | Spatial sky 16325A emission deviations (filled: sky, open: star) | Spatial sky continuum emission | Spatial sky telluric CO2 absorption deviations (filled: H < 10) | |||||||||||||||||||||||
| 0 | 0 |
|
|
|
|
|
|
| IPAIR | NAME | SHIFT | NEWSHIFT | S/N | NAME | SHIFT | NEWSHIFT | S/N |
| 0 | 10890016 | 0.509487 | 0.00000 | 212.893 | 10890018 | 0.00222993 | 0.507257 | 214.827 |
| 1 | 10890013 | 0.508056 | 0.00143099 | 225.037 | 10890014 | 0.00135189 | 0.508135 | 221.665 |
| 2 | 10890012 | 0.508511 | 0.000975966 | 216.432 | 10890015 | 0.00194365 | 0.507543 | 221.106 |
| 3 | 10890017 | 0.509278 | 0.000208974 | 212.224 | 10890011 | 0.00000 | 0.509487 | 213.300 |