| Red | Green | Blue | |
| z | 17.64 | ||
| znorm | Inf | ||
| sky | -Inf | -Inf | -Inf |
| S/N | 21.4 | 38.4 | 43.0 |
| S/N(c) | 0.0 | 0.0 | 0.0 |
| SN(E/C) |
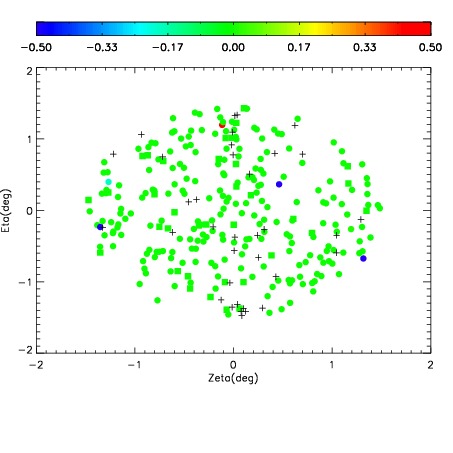
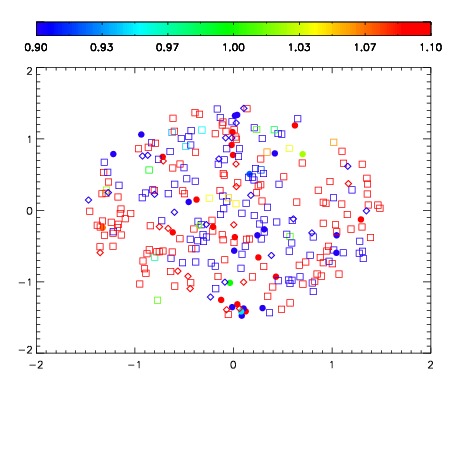
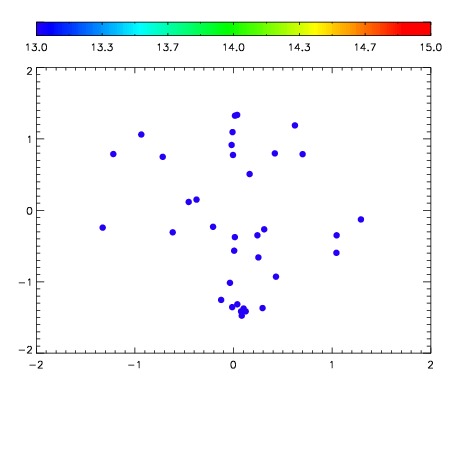

| Frame | Nreads | Zeropoints | Mag plots | Spatial mag deviation | Spatial sky 16325A emission deviations (filled: sky, open: star) | Spatial sky continuum emission | Spatial sky telluric CO2 absorption deviations (filled: H < 10) | |||||||||||||||||||||||
| 0 | 0 |
|
|
|
|
|
|
| IPAIR | NAME | SHIFT | NEWSHIFT | S/N | NAME | SHIFT | NEWSHIFT | S/N |
| 0 | 02590039 | 0.416324 | 0.00000 | 224.985 | 02590044 | -0.00353484 | 0.419859 | 228.410 |
| 1 | 02590038 | 0.415643 | 0.000680983 | 220.051 | 02590041 | -0.00699708 | 0.423321 | 213.368 |
| 2 | 02590043 | 0.414564 | 0.00175998 | 216.383 | 02590040 | -0.00220748 | 0.418531 | 207.050 |
| 3 | 02590042 | 0.411552 | 0.00477198 | 215.550 | 02590037 | 0.00000 | 0.416324 | 202.121 |