| Red | Green | Blue | |
| z | 17.64 | ||
| znorm | Inf | ||
| sky | -Inf | -Inf | -Inf |
| S/N | 11.2 | 22.1 | 24.8 |
| S/N(c) | 0.0 | 0.0 | 0.0 |
| SN(E/C) |
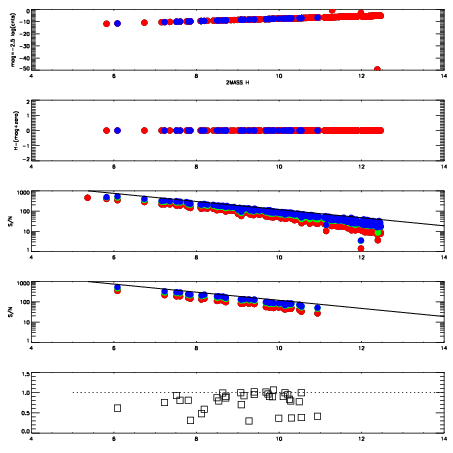
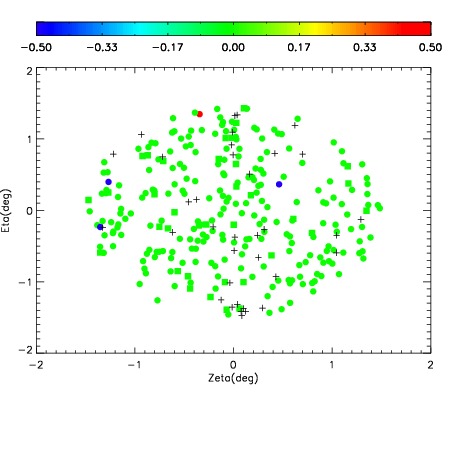
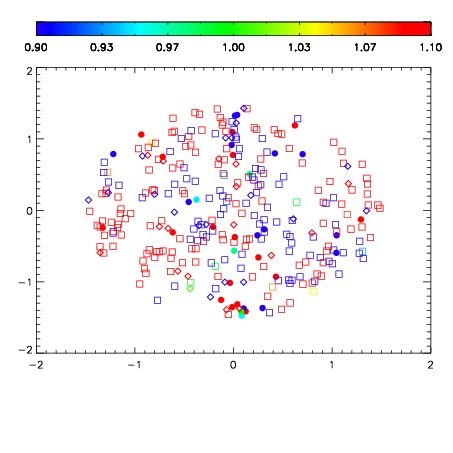
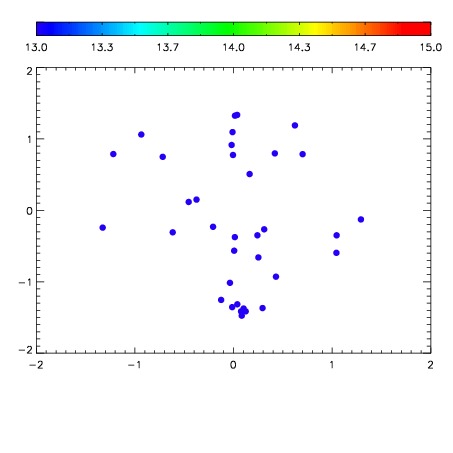

| Frame | Nreads | Zeropoints | Mag plots | Spatial mag deviation | Spatial sky 16325A emission deviations (filled: sky, open: star) | Spatial sky continuum emission | Spatial sky telluric CO2 absorption deviations (filled: H < 10) | |||||||||||||||||||||||
| 0 | 0 |
|
|
|
|
|
|
| IPAIR | NAME | SHIFT | NEWSHIFT | S/N | NAME | SHIFT | NEWSHIFT | S/N |
| 0 | 02620046 | 0.422790 | 0.00000 | 188.558 | 02620043 | 0.000135928 | 0.422654 | 162.741 |
| 1 | 02620042 | 0.421748 | 0.00104198 | 166.963 | 02620040 | 0.00000 | 0.422790 | 135.716 |
| 2 | 02620041 | 0.420130 | 0.00265998 | 145.667 | 02620047 | -0.00105465 | 0.423845 | 124.091 |
| 3 | 02620045 | 0.418504 | 0.00428599 | 88.9401 | 02620044 | -0.00362747 | 0.426417 | 96.0752 |