| Red | Green | Blue | |
| z | 17.64 | ||
| znorm | Inf | ||
| sky | -Inf | -Inf | -Inf |
| S/N | 25.8 | 46.3 | 50.4 |
| S/N(c) | 0.0 | 0.0 | 0.0 |
| SN(E/C) |
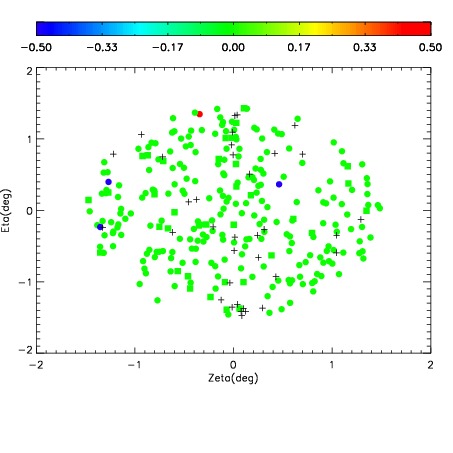
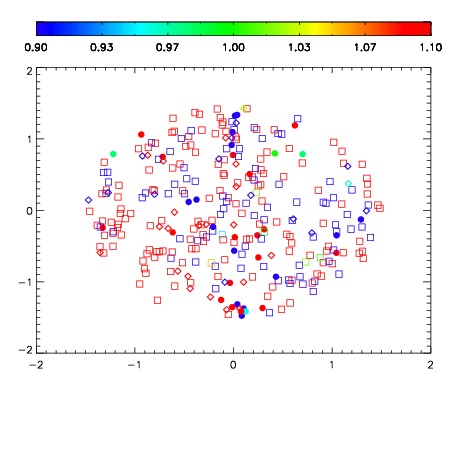
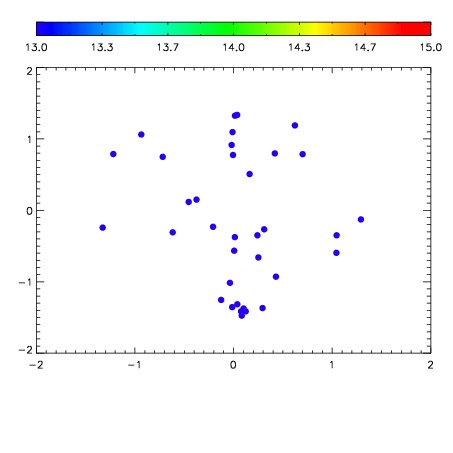

| Frame | Nreads | Zeropoints | Mag plots | Spatial mag deviation | Spatial sky 16325A emission deviations (filled: sky, open: star) | Spatial sky continuum emission | Spatial sky telluric CO2 absorption deviations (filled: H < 10) | |||||||||||||||||||||||
| 0 | 0 |
|
|
|
|
|
|
| IPAIR | NAME | SHIFT | NEWSHIFT | S/N | NAME | SHIFT | NEWSHIFT | S/N |
| 0 | 02780061 | 0.422709 | 0.00000 | 242.607 | 02780059 | -0.00209668 | 0.424806 | 226.747 |
| 1 | 02780057 | 0.422328 | 0.000380993 | 255.621 | 02780054 | 0.00570261 | 0.417006 | 247.886 |
| 2 | 02780056 | 0.417937 | 0.00477198 | 247.514 | 02780055 | -0.000263903 | 0.422973 | 246.995 |
| 3 | 02780052 | 0.417879 | 0.00483000 | 246.700 | 02780058 | 0.00539972 | 0.417309 | 245.582 |
| 4 | 02780053 | 0.418542 | 0.00416699 | 244.879 | 02780062 | 0.00548847 | 0.417221 | 232.943 |
| 5 | 02780060 | 0.419389 | 0.00331998 | 234.097 | 02780051 | 0.00000 | 0.422709 | 188.901 |