| Red | Green | Blue | |
| z | 17.64 | ||
| znorm | Inf | ||
| sky | -NaN | -Inf | -Inf |
| S/N | 17.7 | 33.8 | 36.9 |
| S/N(c) | 0.0 | 0.0 | 0.0 |
| SN(E/C) |
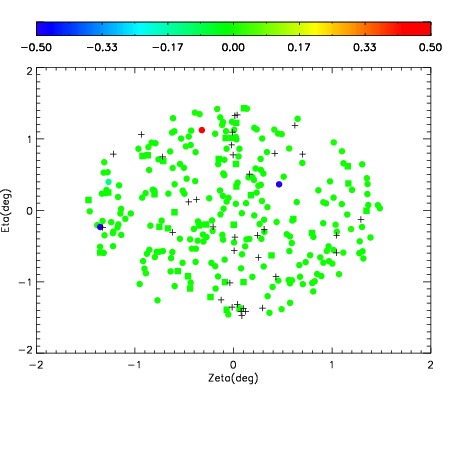
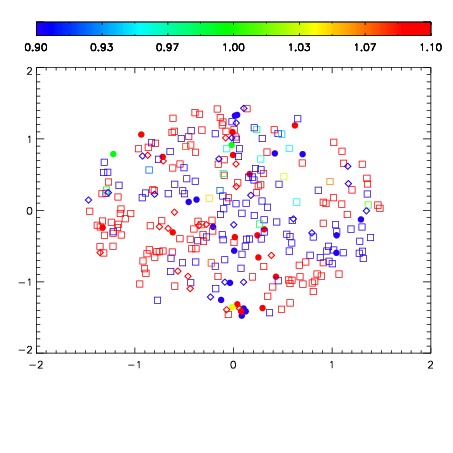
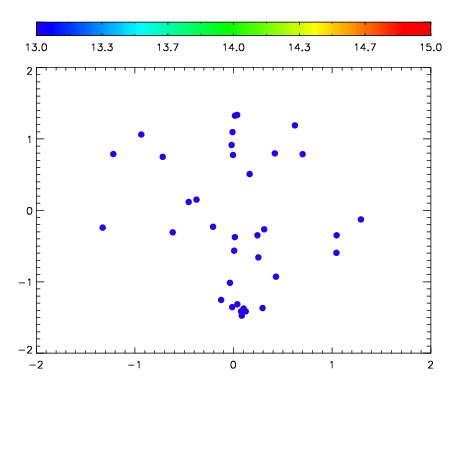

| Frame | Nreads | Zeropoints | Mag plots | Spatial mag deviation | Spatial sky 16325A emission deviations (filled: sky, open: star) | Spatial sky continuum emission | Spatial sky telluric CO2 absorption deviations (filled: H < 10) | |||||||||||||||||||||||
| 0 | 0 |
|
|
|
|
|
|
| IPAIR | NAME | SHIFT | NEWSHIFT | S/N | NAME | SHIFT | NEWSHIFT | S/N |
| 0 | 02820048 | 0.414266 | 0.00000 | 202.278 | 02820049 | 0.00116399 | 0.413102 | 207.960 |
| 1 | 02820047 | 0.412548 | 0.00171798 | 220.680 | 02820046 | 0.00000 | 0.414266 | 214.473 |
| 2 | 02820051 | 0.412446 | 0.00182000 | 166.467 | 02820050 | -0.000628353 | 0.414894 | 191.996 |
| 3 | 02820052 | 0.414174 | 9.19998e-05 | 133.057 | 02820053 | 0.00183620 | 0.412430 | 135.477 |