| Red | Green | Blue | |
| z | 17.64 | ||
| znorm | Inf | ||
| sky | -Inf | -Inf | -Inf |
| S/N | 41.4 | 58.9 | 64.7 |
| S/N(c) | 0.0 | 0.0 | 0.0 |
| SN(E/C) |
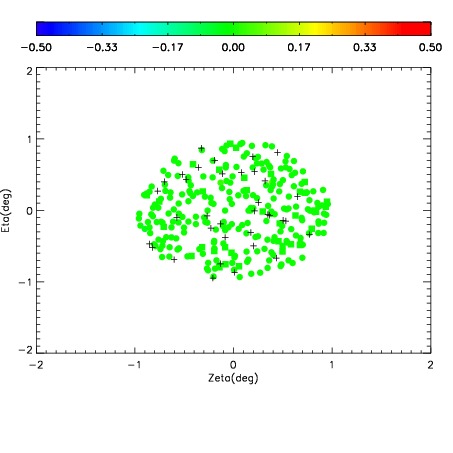
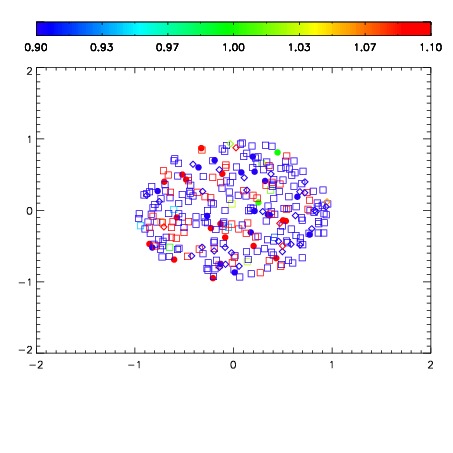
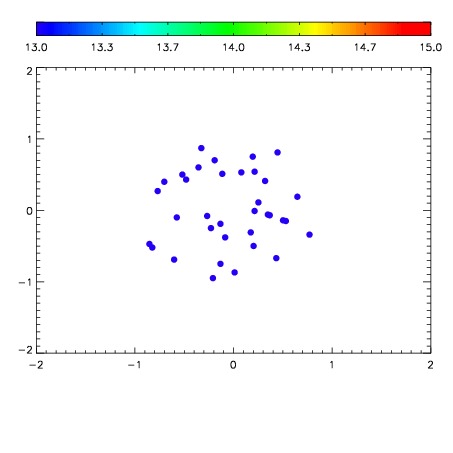

| Frame | Nreads | Zeropoints | Mag plots | Spatial mag deviation | Spatial sky 16325A emission deviations (filled: sky, open: star) | Spatial sky continuum emission | Spatial sky telluric CO2 absorption deviations (filled: H < 10) | |||||||||||||||||||||||
| 0 | 0 |
|
|
|
|
|
|
| 01960021 | 0.00000 | 216.706 |
| 01960022 | 0.00000 | 205.657 |
| 01960023 | 0.00000 | 205.367 |
| 01960024 | 0.00000 | 188.773 |
| 01960025 | 0.00000 | 196.812 |
| 01960026 | 0.00000 | 193.966 |
| 01960027 | 0.00000 | 198.613 |