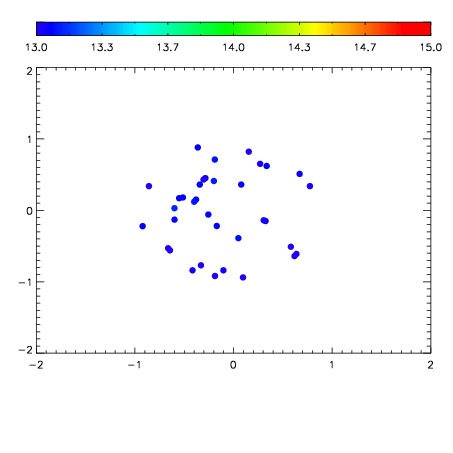
| Frame | Nreads | Zeropoints | Mag plots
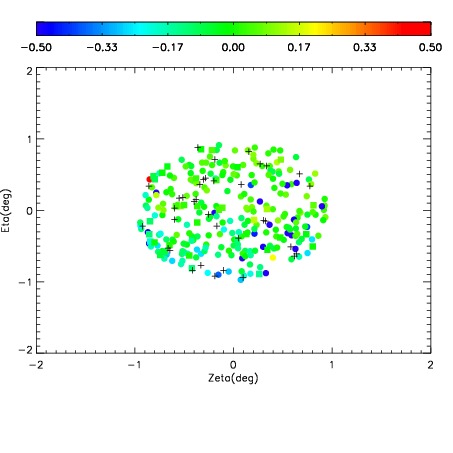
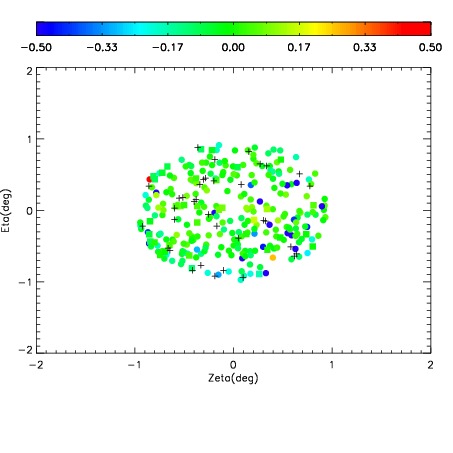
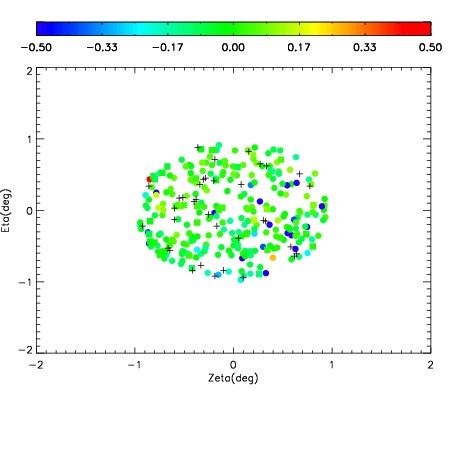
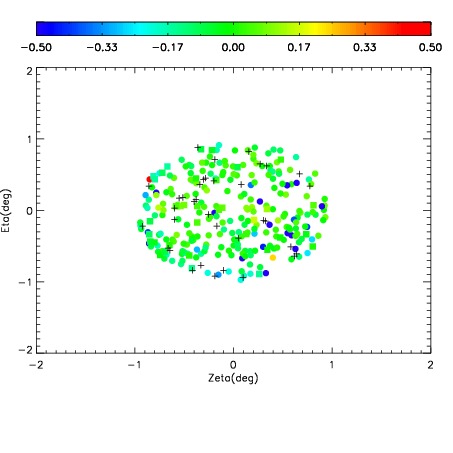
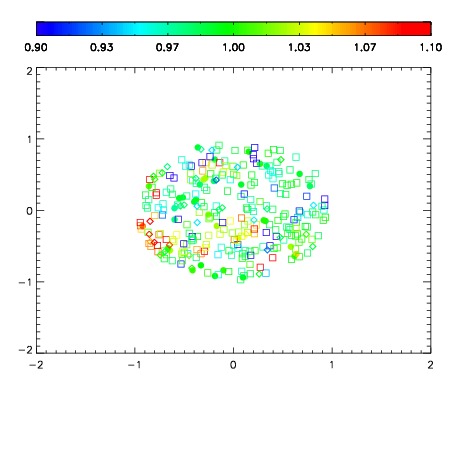
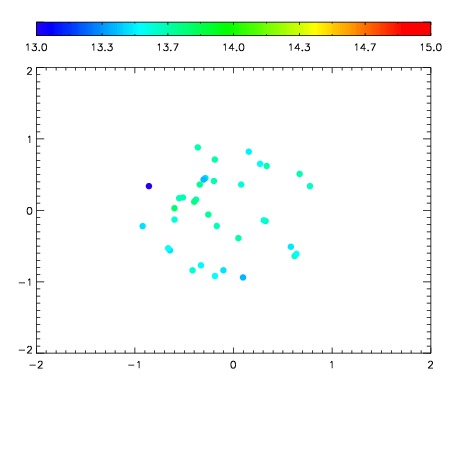
| Spatial mag deviation
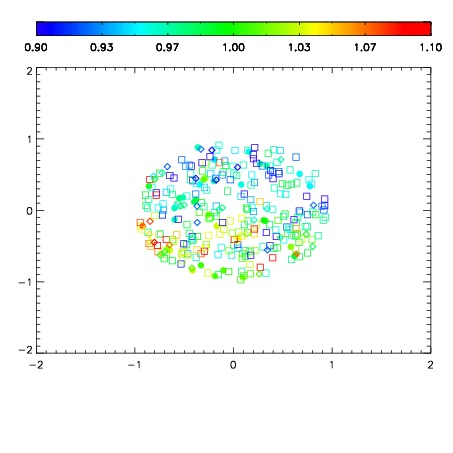
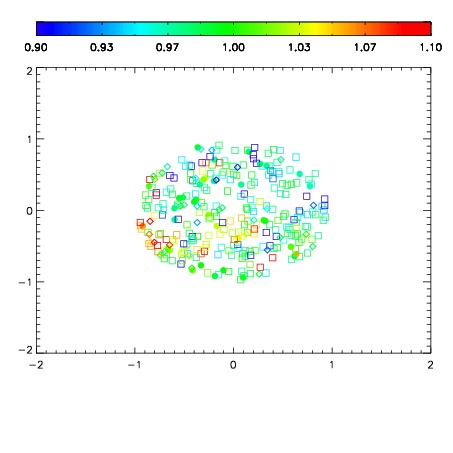
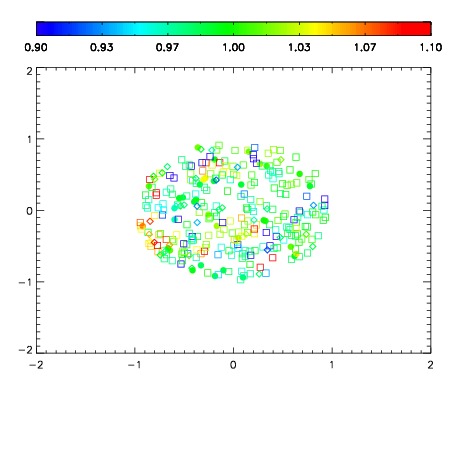
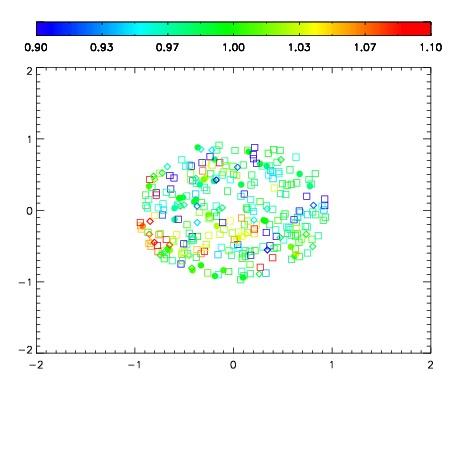
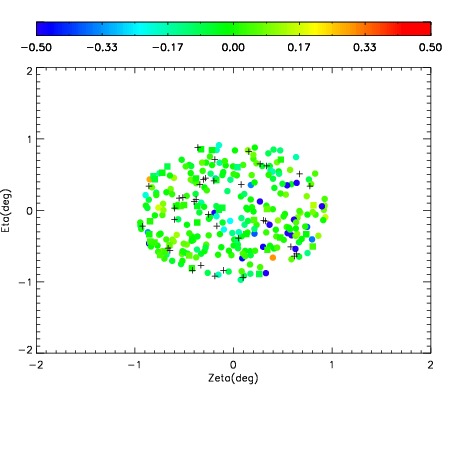
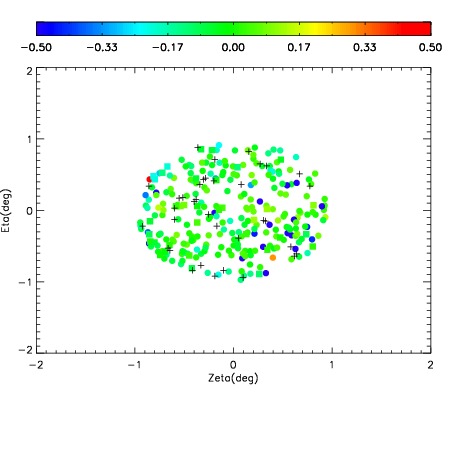
| Spatial sky 16325A emission deviations (filled: sky, open: star)
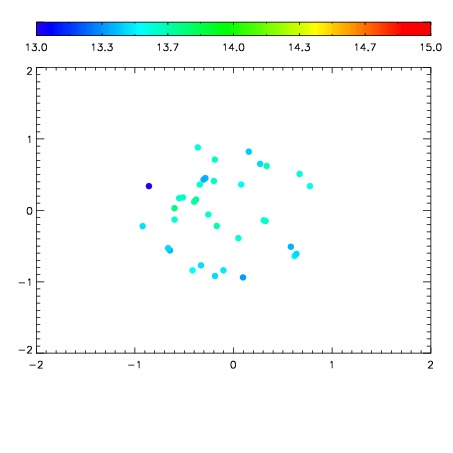
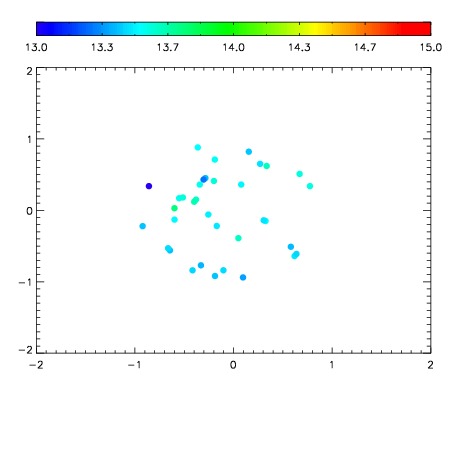
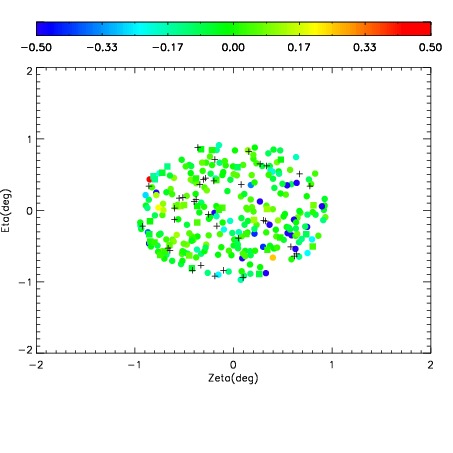
| Spatial sky continuum emission
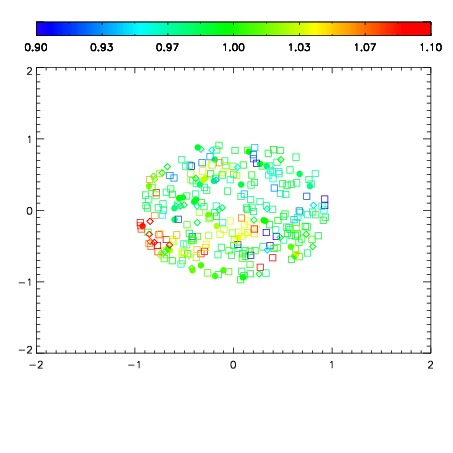
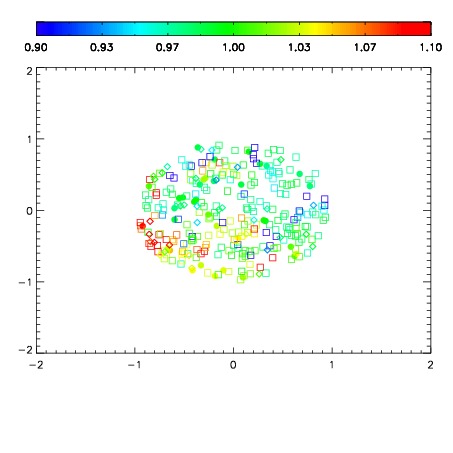
| Spatial sky telluric CO2 absorption deviations (filled: H < 10)
|
| 1970032
| 50
| | Red | Green | Blue
| | z | | 18.77
| | znorm | | 14.52
| | sky | 13.8 | 13.6 | 13.5
| | S/N | 15.2 | 21.2 | 22.8
| | S/N(c) | 14.1 | 19.8 | 21.4
| | SN(E/C) 0.91
|
| 
| 
| 
| 
| 
|
| 1970033
| 50
| | Red | Green | Blue
| | z | | 18.80
| | znorm | | 14.55
| | sky | 13.6 | 13.6 | 13.7
| | S/N | 15.3 | 21.4 | 23.6
| | S/N(c) | 14.1 | 20.1 | 21.7
| | SN(E/C) 0.89
|
| 
| 
| 
| 
| 
|
| 1970034
| 50
| | Red | Green | Blue
| | z | | 18.67
| | znorm | | 14.43
| | sky | 13.6 | 13.5 | 13.6
| | S/N | 14.3 | 20.0 | 22.3
| | S/N(c) | 13.1 | 18.7 | 20.6
| | SN(E/C) 0.97
|
| 
| 
| 
| 
| 
|
| 1970035
| 50
| | Red | Green | Blue
| | z | | 18.82
| | znorm | | 14.57
| | sky | 13.8 | 13.7 | 13.7
| | S/N | 15.6 | 21.7 | 23.6
| | S/N(c) | 14.3 | 20.2 | 22.1
| | SN(E/C) 0.92
|
| 
| 
| 
| 
| 
|
| 1970036
| 50
| | Red | Green | Blue
| | z | | 18.64
| | znorm | | 14.39
| | sky | 13.7 | 13.7 | 13.6
| | S/N | 14.1 | 20.0 | 21.7
| | S/N(c) | 12.5 | 18.7 | 20.4
| | SN(E/C) 0.92
|
| 
| 
| 
| 
| 
|
| 1970037
| 50
| | Red | Green | Blue
| | z | | 18.03
| | znorm | | 13.78
| | sky | 13.1 | 13.0 | 13.2
| | S/N | 9.2 | 13.6 | 15.2
| | S/N(c) | 8.1 | 12.4 | 14.0
| | SN(E/C) 0.98
|
| 
| 
| 
| 
| 
|
| 1970038
| 50
| | Red | Green | Blue
| | z | | 18.64
| | znorm | | 14.39
| | sky | 13.7 | 13.6 | 13.6
| | S/N | 13.9 | 20.0 | 21.6
| | S/N(c) | 12.5 | 18.4 | 20.1
| | SN(E/C) 0.94
|
| 
| 
| 
| 
| 
|