| Red | Green | Blue | |
| z | 17.64 | ||
| znorm | Inf | ||
| sky | -Inf | -Inf | -Inf |
| S/N | 36.9 | 54.1 | 59.3 |
| S/N(c) | 0.0 | 0.0 | 0.0 |
| SN(E/C) |
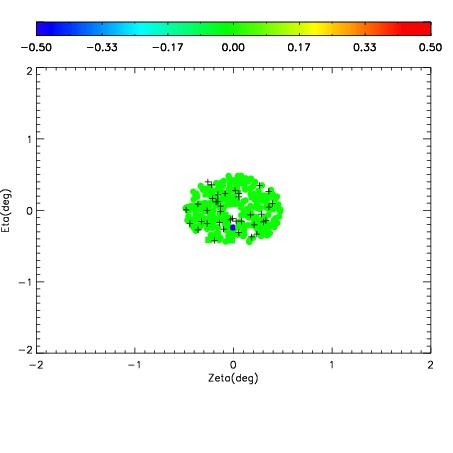
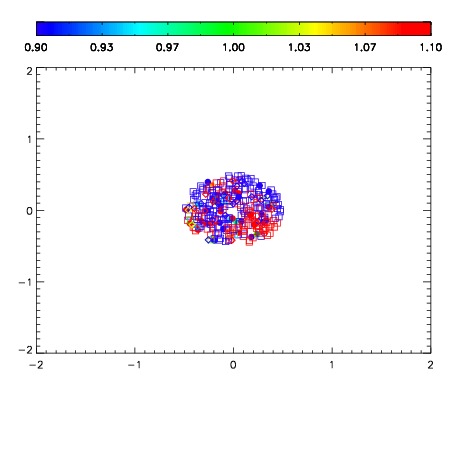


| Frame | Nreads | Zeropoints | Mag plots | Spatial mag deviation | Spatial sky 16325A emission deviations (filled: sky, open: star) | Spatial sky continuum emission | Spatial sky telluric CO2 absorption deviations (filled: H < 10) | |||||||||||||||||||||||
| 0 | 0 |
|
|
|
|
|
|
| 01910024 | 0.00000 | 172.336 |
| 01910025 | 0.00000 | 167.218 |
| 01910026 | 0.00000 | 153.970 |
| 01910027 | 0.00000 | 184.166 |
| 01910028 | 0.00000 | 159.888 |
| 01910029 | 0.00000 | 177.364 |
| 01910030 | 0.00000 | 105.891 |
| 01910031 | 0.00000 | 76.5449 |
| 01910032 | 0.00000 | 155.070 |
| 01910033 | 0.00000 | 178.402 |
| 01910034 | 0.00000 | 189.525 |
| 01910035 | 0.00000 | 182.202 |