| Red | Green | Blue | |
| z | 17.64 | ||
| znorm | Inf | ||
| sky | -Inf | -Inf | -Inf |
| S/N | 29.4 | 43.8 | 47.1 |
| S/N(c) | 0.0 | 0.0 | 0.0 |
| SN(E/C) |
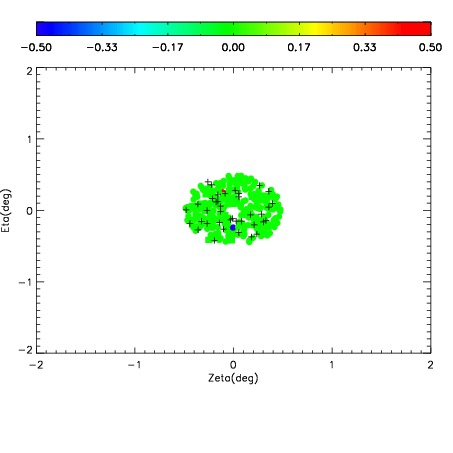
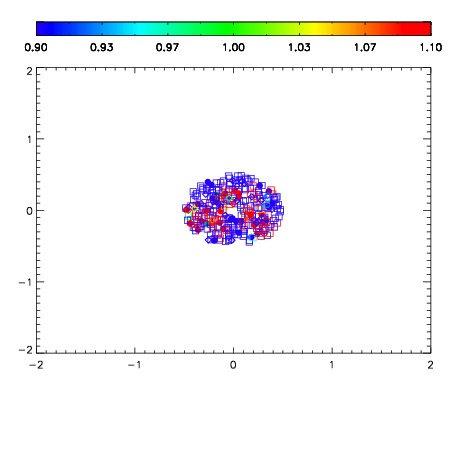
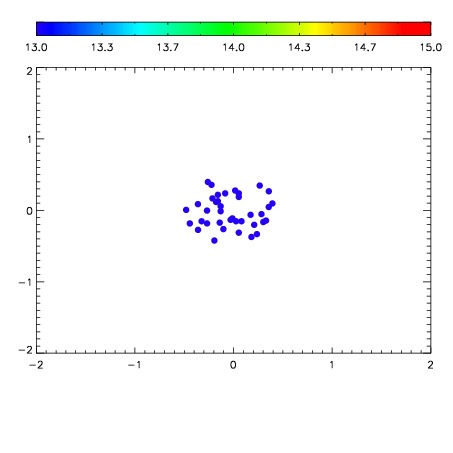

| Frame | Nreads | Zeropoints | Mag plots | Spatial mag deviation | Spatial sky 16325A emission deviations (filled: sky, open: star) | Spatial sky continuum emission | Spatial sky telluric CO2 absorption deviations (filled: H < 10) | |||||||||||||||||||||||
| 0 | 0 |
|
|
|
|
|
|
| IPAIR | NAME | SHIFT | NEWSHIFT | S/N | NAME | SHIFT | NEWSHIFT | S/N |
| 0 | 04870076 | 0.496591 | 0.00000 | 195.345 | 04870073 | 0.000324876 | 0.496266 | 197.683 |
| 1 | 04870071 | 0.494651 | 0.00194001 | 213.967 | 04870070 | 0.00000 | 0.496591 | 214.676 |
| 2 | 04870072 | 0.496442 | 0.000149012 | 197.931 | 04870074 | -0.00174802 | 0.498339 | 199.479 |
| 3 | 04870075 | 0.496002 | 0.000589013 | 186.887 | 04870077 | 0.000525822 | 0.496065 | 189.457 |