| Red | Green | Blue | |
| z | 17.64 | ||
| znorm | Inf | ||
| sky | -Inf | -Inf | -Inf |
| S/N | 12.7 | 17.3 | 19.2 |
| S/N(c) | 0.0 | 0.0 | 0.0 |
| SN(E/C) |
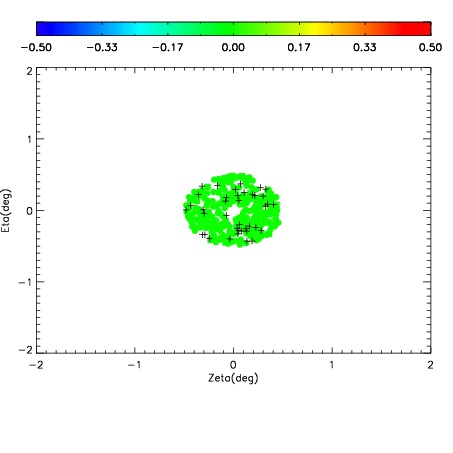
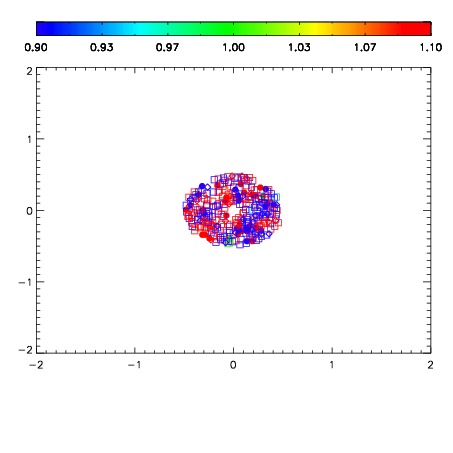
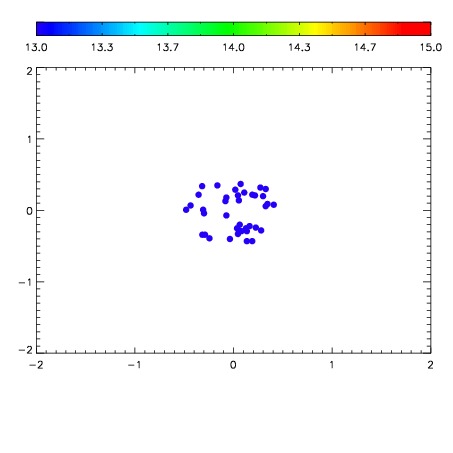

| Frame | Nreads | Zeropoints | Mag plots | Spatial mag deviation | Spatial sky 16325A emission deviations (filled: sky, open: star) | Spatial sky continuum emission | Spatial sky telluric CO2 absorption deviations (filled: H < 10) | |||||||||||||||||||||||
| 0 | 0 |
|
|
|
|
|
|
| 01930009 | 0.00000 | 63.2556 |
| 01930010 | 0.00000 | 45.2667 |
| 01930011 | 0.00000 | 177.981 |
| 01930012 | 0.00000 | 107.908 |
| 01930015 | 0.00000 | 129.339 |