| Frame | Nreads | Zeropoints | Mag plots
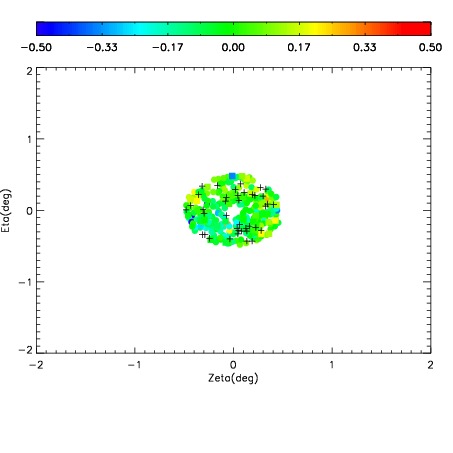
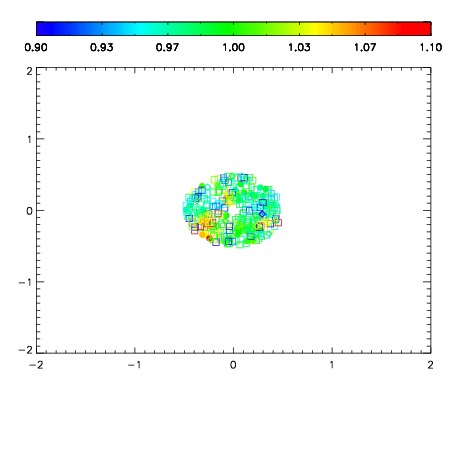
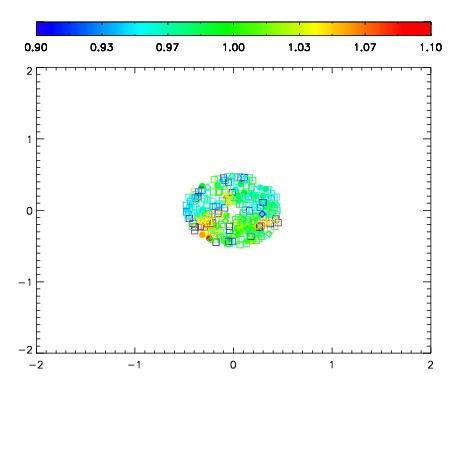
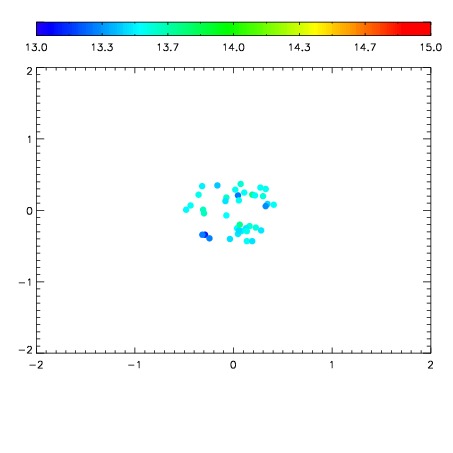
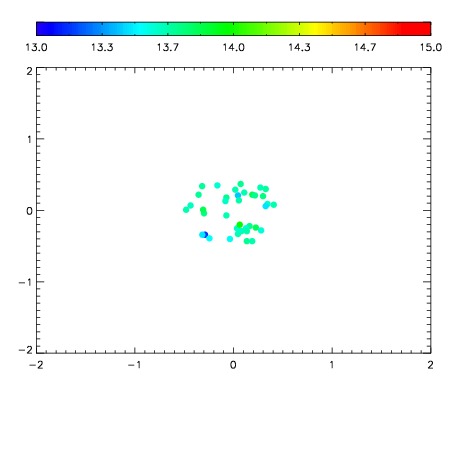
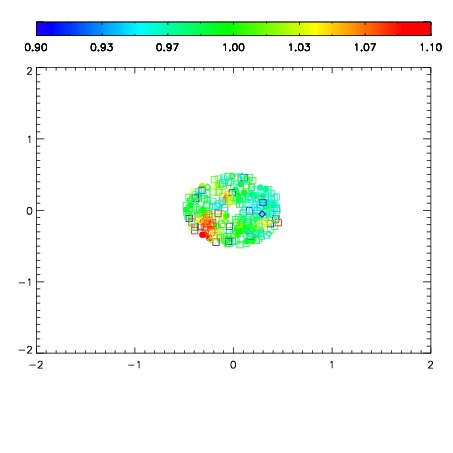
| Spatial mag deviation
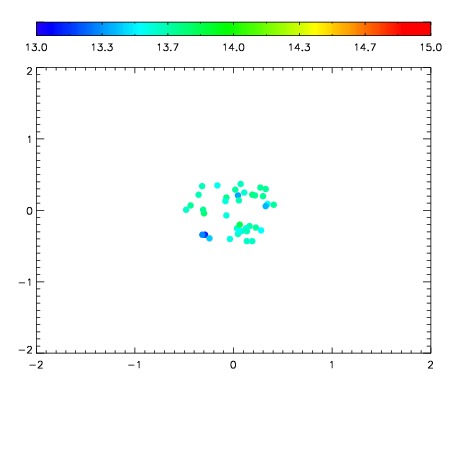
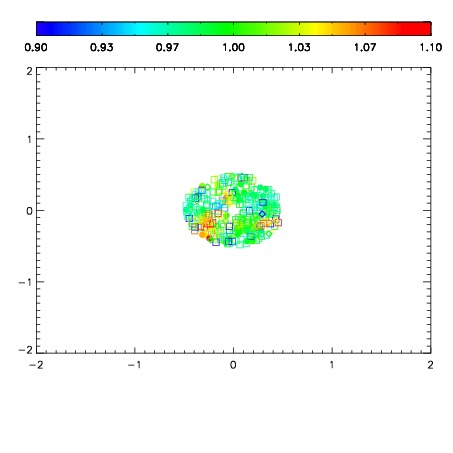
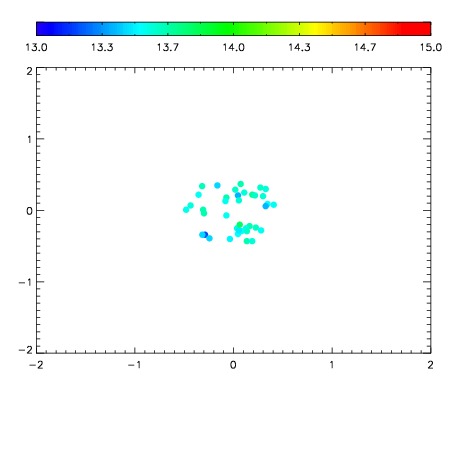
| Spatial sky 16325A emission deviations (filled: sky, open: star)
| Spatial sky continuum emission
| Spatial sky telluric CO2 absorption deviations (filled: H < 10)
|
| 1960031
| 50
| | Red | Green | Blue
| | z | | 18.69
| | znorm | | 14.44
| | sky | 13.7 | 13.5 | 13.5
| | S/N | 14.6 | 20.7 | 22.4
| | S/N(c) | 13.2 | 19.1 | 21.0
| | SN(E/C) 0.80
|
| 
| 
| 
| 
| 
|
| 1960032
| 50
| | Red | Green | Blue
| | z | | 18.65
| | znorm | | 14.40
| | sky | 13.7 | 13.5 | 13.6
| | S/N | 14.4 | 20.6 | 22.3
| | S/N(c) | 12.7 | 18.9 | 20.6
| | SN(E/C) 0.77
|
| 
| 
| 
| 
| 
|
| 1960033
| 50
| | Red | Green | Blue
| | z | | 18.64
| | znorm | | 14.39
| | sky | 13.8 | 13.6 | 13.8
| | S/N | 14.1 | 20.3 | 22.1
| | S/N(c) | 12.6 | 18.9 | 20.5
| | SN(E/C) 0.72
|
| 
| 
| 
| 
| 
|
| 1960034
| 50
| | Red | Green | Blue
| | z | | 18.60
| | znorm | | 14.35
| | sky | 13.7 | 13.5 | 13.7
| | S/N | 13.6 | 19.9 | 21.3
| | S/N(c) | 12.1 | 18.5 | 19.9
| | SN(E/C) 0.75
|
| 
| 
| 
| 
| 
|
| 1960035
| 50
| | Red | Green | Blue
| | z | | 18.62
| | znorm | | 14.37
| | sky | 13.8 | 13.6 | 13.7
| | S/N | 14.4 | 20.5 | 22.0
| | S/N(c) | 12.8 | 18.6 | 20.4
| | SN(E/C) 0.84
|
| 
| 
| 
| 
| 
|
| 1960036
| 50
| | Red | Green | Blue
| | z | | 18.61
| | znorm | | 14.37
| | sky | 13.8 | 13.7 | 13.8
| | S/N | 14.0 | 20.3 | 22.1
| | S/N(c) | 12.6 | 18.7 | 20.5
| | SN(E/C) 0.79
|
| 
| 
| 
| 
| 
|
| 1960037
| 50
| | Red | Green | Blue
| | z | | 18.60
| | znorm | | 14.35
| | sky | 13.7 | 13.6 | 13.6
| | S/N | 13.8 | 20.0 | 21.7
| | S/N(c) | 12.4 | 18.5 | 20.1
| | SN(E/C) 0.76
|
| 
| 
| 
| 
| 
|