| Red | Green | Blue | |
| z | 17.64 | ||
| znorm | Inf | ||
| sky | -NaN | -NaN | -Inf |
| S/N | 33.3 | 49.7 | 54.3 |
| S/N(c) | 0.0 | 0.0 | 0.0 |
| SN(E/C) |
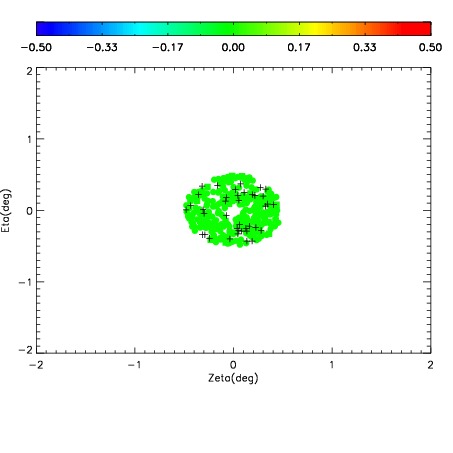
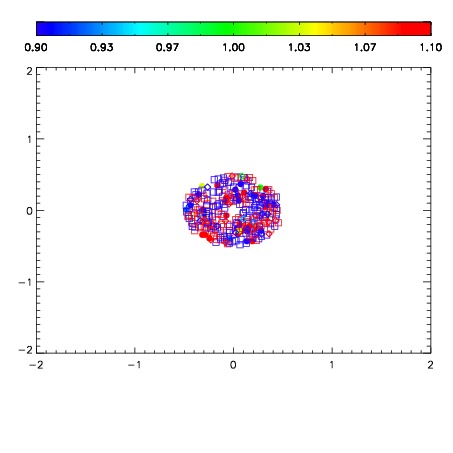
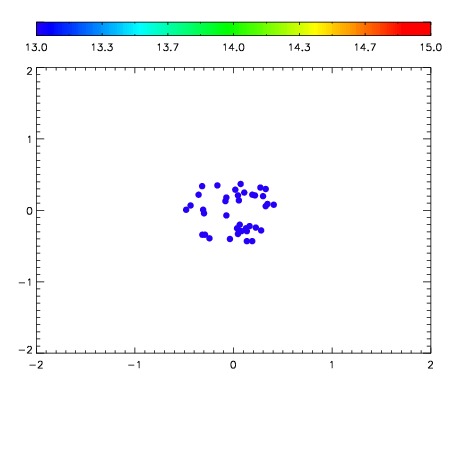

| Frame | Nreads | Zeropoints | Mag plots | Spatial mag deviation | Spatial sky 16325A emission deviations (filled: sky, open: star) | Spatial sky continuum emission | Spatial sky telluric CO2 absorption deviations (filled: H < 10) | |||||||||||||||||||||||
| 0 | 0 |
|
|
|
|
|
|
| 01960031 | 0.00000 | 187.222 |
| 01960032 | 0.00000 | 176.782 |
| 01960033 | 0.00000 | 179.404 |
| 01960034 | 0.00000 | 175.103 |
| 01960035 | 0.00000 | 170.841 |
| 01960036 | 0.00000 | 166.723 |
| 01960037 | 0.00000 | 168.053 |