| Red | Green | Blue | |
| z | 17.64 | ||
| znorm | Inf | ||
| sky | -NaN | -NaN | -Inf |
| S/N | 32.0 | 47.3 | 50.9 |
| S/N(c) | 0.0 | 0.0 | 0.0 |
| SN(E/C) |
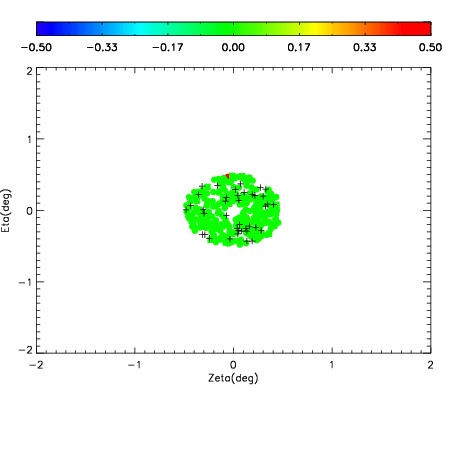
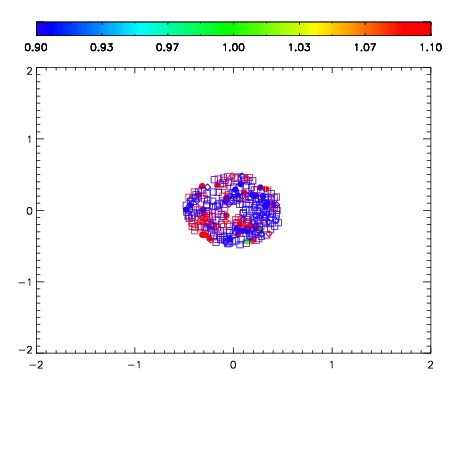


| Frame | Nreads | Zeropoints | Mag plots | Spatial mag deviation | Spatial sky 16325A emission deviations (filled: sky, open: star) | Spatial sky continuum emission | Spatial sky telluric CO2 absorption deviations (filled: H < 10) | |||||||||||||||||||||||
| 0 | 0 |
|
|
|
|
|
|
| IPAIR | NAME | SHIFT | NEWSHIFT | S/N | NAME | SHIFT | NEWSHIFT | S/N |
| 0 | 12740048 | 0.480551 | 0.00000 | 201.932 | 12740043 | 0.00000 | 0.480551 | 198.184 |
| 1 | 12740049 | 0.479641 | 0.000910014 | 211.069 | 12740050 | -0.00241515 | 0.482966 | 214.567 |
| 2 | 12740044 | 0.478877 | 0.00167400 | 205.445 | 12740047 | -0.00254929 | 0.483100 | 203.719 |
| 3 | 12740045 | 0.479552 | 0.000999004 | 196.416 | 12740046 | -0.00220716 | 0.482758 | 194.327 |