| Red | Green | Blue | |
| z | 17.64 | ||
| znorm | Inf | ||
| sky | -NaN | -Inf | -Inf |
| S/N | 24.3 | 41.8 | 44.1 |
| S/N(c) | 0.0 | 0.0 | 0.0 |
| SN(E/C) |
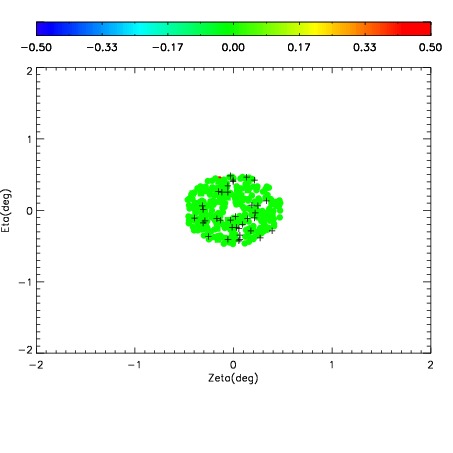
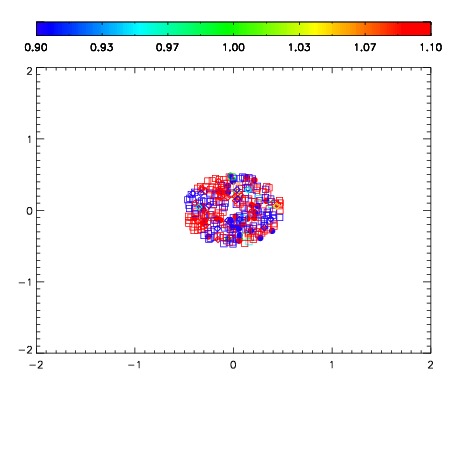
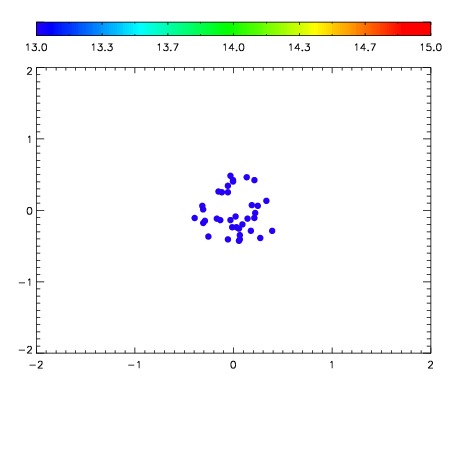

| Frame | Nreads | Zeropoints | Mag plots | Spatial mag deviation | Spatial sky 16325A emission deviations (filled: sky, open: star) | Spatial sky continuum emission | Spatial sky telluric CO2 absorption deviations (filled: H < 10) | |||||||||||||||||||||||
| 0 | 0 |
|
|
|
|
|
|
| IPAIR | NAME | SHIFT | NEWSHIFT | S/N | NAME | SHIFT | NEWSHIFT | S/N |
| 0 | 12770023 | 0.486842 | 0.00000 | 207.437 | 12770024 | 0.000692721 | 0.486149 | 201.619 |
| 1 | 12770018 | 0.485557 | 0.00128502 | 211.566 | 12770017 | 0.00000 | 0.486842 | 202.928 |
| 2 | 12770019 | 0.485443 | 0.00139901 | 204.488 | 12770021 | 0.00167069 | 0.485171 | 200.768 |
| 3 | 12770022 | 0.486753 | 8.90195e-05 | 204.107 | 12770020 | 0.00138817 | 0.485454 | 185.249 |