| Red | Green | Blue | |
| z | 17.64 | ||
| znorm | Inf | ||
| sky | -NaN | -Inf | -Inf |
| S/N | 35.8 | 53.7 | 61.8 |
| S/N(c) | 0.0 | 0.0 | 0.0 |
| SN(E/C) |
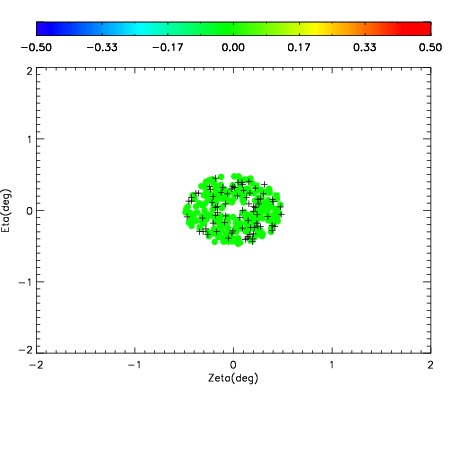
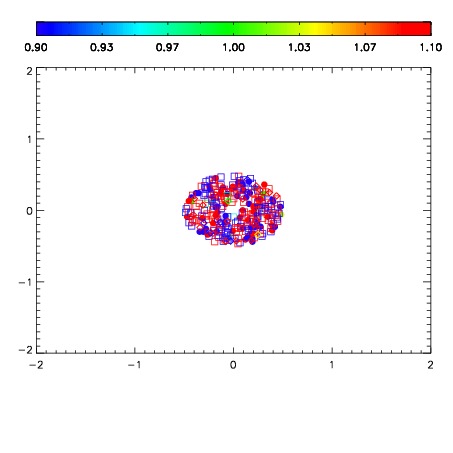
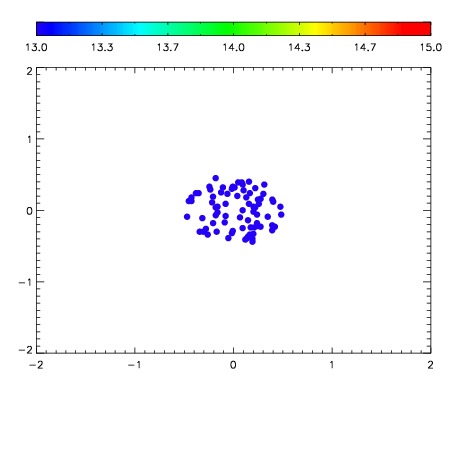

| Frame | Nreads | Zeropoints | Mag plots | Spatial mag deviation | Spatial sky 16325A emission deviations (filled: sky, open: star) | Spatial sky continuum emission | Spatial sky telluric CO2 absorption deviations (filled: H < 10) | |||||||||||||||||||||||
| 0 | 0 |
|
|
|
|
|
|
| 01890040 | 0.00000 | 150.834 |
| 01890041 | 0.00000 | 148.634 |
| 01890042 | 0.00000 | 146.830 |
| 01890043 | 0.00000 | 145.848 |
| 01890044 | 0.00000 | 147.756 |
| 01890045 | 0.00000 | 143.534 |
| 01890046 | 0.00000 | 148.380 |
| 01890047 | 0.00000 | 139.621 |
| 01890048 | 0.00000 | 137.163 |
| 01890049 | 0.00000 | 144.912 |